Introduction
When I attended Michigan Law School in 1966, as a 2L Harvard transfer, there was only one, or perhaps two, African Americans in a student body of about 1100 students, and if there were any students of Latino heritage their presence went unnoticed. When I began teaching at Michigan in the fall of 1968, the situation had begun to change. There were eight or nine African American students in the first year class, the first cohort to be admitted under a newly-approved racially sensitive affirmative action program. Since then, Michigan has graduated more than 1500 minority students, most of whom would not have been admitted but for affirmative action. These students have gone on to have careers every bit as successful as those of their white counterparts; they have been of particular service to members of their ethnic communities, and from among their ranks have come leaders in business, the government, and the bar.1 Similar stories can be told of the affirmative action graduates of other law schools and the beneficiaries of affirmative action at undergraduate institutions. Yet affirmative action continues to be attacked, not just on doctrinal grounds reflecting different interpretations of what the Fourteenth Amendment requires, but also with the empirical claim that affirmative action harms those it is intended to benefit.
I. The Theory in a Nutshell
At oral argument for the U.S. Supreme Court’s second go-round with Fisher v. University of Texas at Austin (Fisher II), Justice Scalia interrupted the lawyer representing the University of Texas (UT) with the comment, “There are those who contend that it does not benefit African Americans to—to get them into UT where they do not do well, as opposed to having them go to a less-advanced school, a less—a slower-track school where they do well . . . .” Scalia, apparently relying on amicus briefs submitted by Richard Sander2 and by Gail Heriot and Peter Kirsanow,3 was preaching the gospel of mismatch theory. This gospel argues that learning is hampered when students attend colleges or universities where their academic skills (typically measured by prior grades and test scores) are substantially below the median of most students. The reason, according to mismatch theory, is that because professors pitch their lectures and assignments to the level of the median student, students with academic credentials well below their school’s median find it hard to understand lectures and assignments and otherwise keep up. Since minorities who receive a boost from affirmative action often have academic credentials well below those of their school’s median student, they are, it is argued, overmatched. It follows, according to mismatch theory, that they will learn less than they would have had they attended less selective schools, and consequently will be less successful not only in college but also later in life.
This argument is problematic in several respects. It assumes that professors pitch their lectures to the level of the median student, and, on the assumption this is true, it assumes that students with academic credentials much below the school’s median student will be unable to keep up. But no mismatch theorist has looked empirically at the level at which instruction is pitched, nor has attention been paid to ways of learning course material other than classroom instruction, such as office hours conversations with professors or peer tutoring. These might undercut the second assumption, if the assumption were true to begin with. The argument also ignores the possibility that even if the first two assumptions held, any later disadvantages associated with them might be more than made up by networking opportunities, degree prestige, and an ethic of hard work that might be associated with attending more selective institutions.
Policy makers and the courts need not, however, rely on assumptions. Mismatch theory may be tested by looking empirically at how successful affirmative action’s beneficiaries are in gaining degrees and later in life. To anticipate a conclusion, when relevant data are examined, the results are far different from what we would expect to see if the assumptions underlying mismatch theory were true.
Even before mismatch theory could be tested, critics of affirmative action have argued that because of mismatch,4 African American5 students are harmed rather than helped by affirmative action.6 The critics’ arguments have persuaded some because mismatch theory is intuitively plausible. There are, however, equally plausible arguments that mismatch is not a problem. As a piece of popular wisdom, the “rise to the challenge” story has as much going for it as the “overmatched” trope. Storytelling will not, however, resolve the conflict, but empirical research can, and there are now many studies that put mismatch theory to empirical tests.
The empirical data indicate that being academically overmatched does not harm and may well help beneficiaries of affirmative action. Most studies that reach different conclusions, including those that Justice Scalia relied on, have not withstood critical scrutiny. There are, however, a few methodologically sounder studies which find that, controlling for academic credentials, minority students who express an initial interest in pursuing science majors may be more likely to persist to science degrees at less selective institutions. When critics of affirmative action cite this research, they use the term “science mismatch,” but this is a misnomer. To the extent that causes have been identified, they have more to do with competitive curve-based grading and campus cultures, including learning environments, than with the learning difficulties that mismatch theorists see as ameliorated by attending less selective institutions. Moreover, students who desist from science majors are like their peers in their ability to be successful in the majors they eventually choose.
One does not have to be a racist to champion mismatch theory, but the theory comforts those who oppose affirmative action regardless of why they oppose it. They can claim their opposition stems from a desire to see minority students maximally benefit from the education they receive. This comfort function may also be why amicus briefs advancing mismatch theory were offered to the Court in both Fisher v. University of Texas at Austin (Fisher I) and Fisher II. Legally, it is difficult to see how the possibility of mismatch relates to the fundamental issues of Fourteenth Amendment jurisprudence that Abigail Fisher raises. But psychologically the Justices might be more predisposed to side with Fisher and against the university, if they thought that the admissions policies that UT was strenuously defending in fact harmed rather than helped minority students. Maintaining campus diversity may well be a cognizable constitutional value, but it would be a value that would be harder to defend if the only way it could be instantiated was by disadvantaging those minorities whom the Civil War Amendments were passed to protect.
Space constraints prevent me from offering a complete review of the literature. Hence this Essay will focus on research relating to undergraduates and studies of science desistence (so-called science mismatch), neither of which has received much law review attention.7 I shall touch only briefly on the now discredited research on law students by Richard Sander and Doug Williams.
II. Bowen, Bok, And Others
A pathbreaking book by William Bowen and Derek Bok, published in 1998, was the first to systematically examine how beneficiaries of affirmative action fared.8 Using the College and Beyond (C&B) database collected by the Andrew W. Mellon Foundation, the authors had rich information on more than 80,000 undergraduate students who, as members of one of three cohorts, had matriculated at twenty-eight of the nation’s most selective colleges and universities. Bowen and Bok’s analysis focuses on black and white students in two of the C&B’s three cohorts: those beginning college in the fall of 1976 and those beginning in the fall of 1989. Within the cohorts, students were clustered by SAT scores into one of five intervals. Looking at the 1989 cohort, Bowen and Bok found that SAT scores had a “mildly positive” relationship to graduation rates.9 They also found that within each interval, whites had higher graduation rates than blacks with gaps ranging from 5 to 10 percent.
But this is not the end of the story. Within each SAT interval, black students in the most selective schools had higher graduation rates than blacks in less selective schools, and within four of the five intervals, blacks in the medium selectivity schools had higher graduation rates than blacks in the least selective tier. For example, within the middle range of the distribution, which consists of black students who had SAT scores between 1100 and 1199, 87 percent of those in schools where the mean campus SAT score was above 1300 graduated, which is substantially higher than the 78 percent of blacks who graduated from campuses where the mean SAT score was between 1151 and 1300. This, in turn, is higher than the 72 percent who graduated from schools where the mean SAT score was 1150 or below.10 It is hard to imagine results less consistent with mismatch theory. Furthermore, black students in schools where most white students have SAT scores that are 100 to 200 points higher than theirs graduate at almost the same rate as their white counterparts (87 percent vs. 90 percent), while those with SAT scores closer to their campus-wide means do substantially worse than their white counterparts (72 percent vs. 85 percent).
Following Bowen and Bok’s seminal research, numerous other scholars have tested the hypothesis that mismatch harms the undergraduate beneficiaries of affirmative action. Not only do researchers fail to find evidence of mismatch, but more often than not they find that minorities benefit from attending schools where they are, according to the theory, overmatched. Mary Fischer and Douglas Massey, for example, analyzed data from the 1999 National Longitudinal Survey of Freshmen (NLSF), which added University of California (UC) Berkeley to the institutions Bowen and Bok had examined. Controlling for background characteristics, they looked at college grade point averages (GPAs) and the odds of dropping out.11 Their estimates “provided no evidence whatsoever for the mismatch hypothesis.”12 Rather, their data suggest that “minority students who benefited from affirmative action earned higher grades and left school at lower rates than others, and they expressed neither greater nor less satisfaction with college life in general.”13 In addition, Fisher and Massey looked specifically at whether greater differentials (supposed mismatch) between minority students’ SAT scores and their schools’ mean SAT scores related to dropping out. It did, but not as the mismatch hypothesis would predict. “For each 10 points increase in the gap between the individual’s SAT score and the institutional average, there was an 8.5 percent decrease in the likelihood of leaving college.”14
Mario Small and Christopher Winship, using C&B and supplementary data, also found “a clear benefit of Affirmative Action in elite institutions.”15 Here’s how they describe their work:
We ask three questions: Do institutional factors affect black students’ probability of graduation? Do they account for between-institution differences in black graduation? And are institutions where blacks have a high probability of graduation the same as or different from those where whites do? Testing for the effect of eight major institutional factors, we find, surprisingly, that only selectivity has a statistically significant effect. Contrary to common belief, selectivity improves black probabilities of graduation, and helps blacks more than it helps whites.16
Proponents of mismatch theory deny that the findings of Bowen and Bok and others refute their hypothesis. They argue that the empirical data are distorted due to selection bias and that had the minority students at more selective schools attended less selective institutions, they would have done even better. Their logic is that if minority students with similar admissions test scores and GPAs are at different quality schools, it must be because those admitted to the top tier schools are considerably stronger on unmeasured aspects of their applications, like letters of recommendation, that make them more attractive and predict to later performance. Lost on those making this argument is an important implication. If the argument is true, it means that affirmative action minorities admitted to selective schools have not received the large boost these critics claim. For the selection bias argument to be credible, the students’ academic strengths, when evaluated holistically, would have to be far greater than test scores and GPAs make them appear. Affirmative action would then be not so affirmative. This may well be the case, but whether it is or not selection bias cannot save mismatch theory from empirical refutation.
Not only did Bowen and Bok control for many factors that might affect performance, making it extremely unlikely that the reverse mismatch effects they identified are due to selection on a few unobservables,17 but also studies that use modern statistical techniques to control for selection bias yield similar results. Sigal Alon and Marta Tienda, for example, examined two longitudinal surveys and employed three different methods to control for selection bias. Looking not just at African Americans but also at Hispanics, whites, and Asians, they found “that conditional on admission, all groups of students who attended selective institutions were more likely to graduate within six years of enrollment than were their counterparts who attended less-selective colleges.”18 Turning to the C&B data set used by Bowen and Bok, Alon and Tienda note that these data come from students at some of the country’s more and most selective institutions, which limits the data’s capacity to test the mismatch hypothesis. Within these limits, however, selection bias does not pose a problem. Instead, “taking the selection on unobservables into account, the minority students’ gains from attending the most selective institutions in the country are even larger than are those produced by the other methods.”19 Tatiana Melguizo reported similar results after controlling for selection bias. She concluded that “affirmative action policies are positive not only in terms of increasing the number of minorities enrolled in selective institutions, but also that once there, minorities benefit by having higher probabilities of attaining a bachelor’s degree.”20
Other social scientists have relied on natural experiments to evaluate the impact of affirmative action while controlling for selection bias. Kalena Cortes examined data from the post-Hopwood v. Texas, pre-Grutter v. Bollinger period, when race-conscious affirmative action was barred in Texas but students in the top 10 percent of their high school class were guaranteed a place in any public university in the state.21 If mismatch had been a problem, minorities who graduated in the second or third deciles in their high school classes should have had college graduation rates more like those of white students since they could no longer be admitted to schools where they were academically mismatched. Contrary to the predictions of mismatch theory, Cortes found that the gap between minority and nonminority graduation rates widened by one fifth after Hopwood. She concludes, “I find no evidence in support of the minority ‘mismatch’ hypothesis.”22
Some studies, like those of Bowen and Bok and Alon and Tienda, follow their subjects beyond graduation, seeking to measure future success. As with graduation rates, these studies find that ostensible overmatch is associated with greater rather than lesser success over the long term. Stacy Dale and Alan Krueger’s work (2014) is particularly instructive.23 Controlling for academic credentials and selection bias, they found that affirmative action minorities but not whites earned more if they attended more selective schools. Thus, not only do minorities benefit from affirmative action, but in addition whites displaced to less selective schools by minority preferences suffer no future income harm. Dale and Krueger suggest that the impact of college selectivity on future earnings may differ between whites and minorities because “networking opportunities . . . from attending a selective college may be particularly valuable for black and Hispanic students.”24
An alternative approach is to look longitudinally at the graduates of a single selective institution. Here, the mismatch hypothesis predicts that if the admissions credentials of those admitted through affirmative action are substantially below those of most other students, then these admittees should do worse than other students, both in school and beyond. It is this prediction that two colleagues and I tested when we examined the law school and career trajectories of students matriculating at the University of Michigan Law School during the school’s first twenty-seven years of affirmative action admissions.25 The minority admittees in our sample did receive lower law school grades than whites, but after law school the two groups fared equally well. Graduation and bar passage rates were similar, as were earnings after law school and career satisfaction. The most salient differences were that the school’s African American graduates did significantly more community service and pro bono work than the school’s white graduates, and that lawyers, regardless of ethnicity, were disproportionately likely to serve members of their own ethnic group.26
To sum up, the mismatch hypothesis predicts that beneficiaries of affirmative action will be less likely to finish their programs and if they do succeed in graduating, will have less success over the long run than if they had attended less selective schools. With the exception of some controversial and deeply flawed research, this is not what studies have found. Beyond measures like college grades and class rank, which are normed within institutions, researchers find either no evidence of mismatch effects or that the evidence suggests reverse mismatch effects. When outcomes for undergraduates are examined, researchers are particularly likely to find that minorities who attend more selective schools tend to do better than similar students at less selective institutions.
III. Sander and His Critics
The empirical case for mismatch rests largely on the work of Professor Richard Sander, a lawyer and economist at the UCLA School of Law, and that of several other economists who often share with Sander the support of the Searle Foundation.27 Much of this work uses one data source, the Bar Passage Study (BPS), which contains data on most members of the cohort of students who entered law school in the fall of 1991. The BPS follows these students through law school graduation and their first several attempts to pass the bar. The BPS is too dated to have much current policy relevance because the quality of minority applicants seeking admission to law school, as measured by Law School Admission Test (LSAT) scores, has risen substantially since 1991. This matters because the relationship of LSAT scores to success in law school and on the bar exam appears to be more of a step function than a continuous one; that is, students entering law school with LSAT scores below a certain level have considerable difficulty with legal studies and on the bar exam but once a certain threshold is exceeded, difficulties diminish dramatically. Today, a much higher proportion of affirmative action admittees have scores well above the threshold, and 1991’s lowest scoring minorities have almost entirely disappeared.28
Yet even if the BPS sample were not dated, Sander’s results could be dismissed because they have been thoroughly discredited.29 Among those who have examined the data Sander used and found his conclusions unsupported are Chambers et al.,30 Rothstein and Yoon,31 Ayres and Brooks,32 Camilli et al.,33 Camilli and Welner,34 Ho,35 and Xiang and Rubin.36 Most telling is the message conveyed in an amicus brief filed by a group of empirical scholars in Fisher I37 and refiled during Fisher II. The brief’s authors include some of the country’s leading social science methodologists, including two members of the National Academy of Science, most of whom were previously uninvolved in the affirmative action debates. They advised the Court that Sander’s “‘mismatch’ research fails to satisfy the basic standards of good empirical social-science research,” and that these failures “lead him to draw unwarranted causal inferences” and “call into question the conclusions of [his] research.”38
Moreover, since that brief was written, Kidder and Lempert39 spotted an overlooked problem with the BPS data set that substantially biases all research using these data in favor of mismatch theory. This bias means that the few studies that find mismatch effects would, even if they had no other flaws, offer no support to the mismatch hypothesis, and it suggests that studies finding no mismatch may have in fact found evidence for reverse mismatch effects. The nub of the problem is that schools in the BPS are sorted into six tiers and the research using these data has assumed the tiers are ordered by selectivity, such that Tier 1 schools are academically more selective than Tier 2 schools, that Tier 2 schools are more selective than Tier 3 schools, etc. Analyses have then proceeded on the assumption that if, controlling for credentials, minority students in a lower tier do better in graduating and passing the bar than those in a higher tier, that is evidence of mismatch. But the tiers were not constructed so as to distinguish schools solely on the basis of their students’ academic index scores. For example, statistically speaking, Tier 3 schools do not differ significantly from Tier 2 schools on their students’ mean admissions credentials. They do, however, differ significantly in other respects. Tier 3 schools have a student faculty ratio of about 21:1, while at Tier 2 schools it is close to 28:1. Furthermore, the mean tuition of $3500 at Tier 3 schools is less than one third of the Tier 2 mean of $11,200. These characteristics suggest that Tier 3 schools provide a better learning environment than Tier 2 schools and that students attending them are less likely to drop out for financial reasons. So if Tier 3 minorities do better at graduating and passing the bar than similarly credentialed Tier 2 minorities, this is an expected outcome that offers no support to the mismatch hypothesis. In addition, Tier 6 is comprised solely of the nation’s historically black law schools. If Tier 6 students do better, controlling for admissions credentials, than African American students in other tiers, mismatch need be no part of the explanation. Tier 6 minorities attend schools with low tuition costs; they are present in numbers sufficient to constitute a critical mass; they have professors of their same race as role models; and they most likely take bar exams in states with less stringent than average bar passage standards. Unless the models used to evaluate the BPS data exclude Tier 6 students and assume that, academic credentials being equal, Tier 3 students should do better than Tier 2 students, the BPS cannot be used to fairly evaluate the mismatch hypothesis.
Professor Sander has not, however, given up on his mismatch claims. In an amicus brief submitted in Fisher II,40 Sander devoted much of his mismatch discussion to a forthcoming review of the mismatch hypothesis by Peter Arcidiacono and Michael Lovenheim,41 and to an experiment by Scott Carrell, Bruce Sacerdote, and James West.42 Reading these papers, however, one wonders how Sander can find solace in either.
Sander seeks to convey the bottom line message of the Arcidiacono and Lovenheim review in a single quote:
The evidence suggests that racial preferences are so aggressive that reshuffling some African American students to less-selective schools would improve some outcomes due to match effects dominating quality effects. The existing evidence indicates that such match effects may be particularly relevant for first-time bar passage and among undergraduates majoring in STEM fields.43
Sander does not, however, quote past the point where Arcidiacono and Lovenheim’s words cease to serve him. The passage continues:
However, shifting minority undergraduates to low-resource non-selective schools ultimately may undo any gains from higher match quality, and shifting minorities out of law schools altogether could lead to worse labor market outcomes among these students than had they been admitted to some law school.44
He similarly does not repeat Arcidiacono and Lovenheim’s comment that:
A problematic conclusion one could draw from Sander’s results is that everyone is harmed by going to a more elite law school . . . . [I]f there are cross-race differences in mismatch effects, generalizing these estimates to a sample of African American students could yield misleading conclusions about the extent of mismatch.45
Nor does Sander attend to Arcidiacono and Lovenheim’s caution that their best reading of the BPS studies indicates that a “modest” mismatch effect exists but that it could be ameliorated by somewhat less aggressive affirmative action.46 He further ignores their caution that the data may be too noisy and too imprecise to allow any concrete conclusions about mismatch in law schools to be drawn.47 Moreover, even this lukewarm assessment of what the BPS studies have to offer is too generous because when they wrote, Arcidiacono and Lovenheim were unaware of the ambiguity in the BPS tier ordering noted above and that Xiang and Rubin48 had published a study that failed to find mismatch effects.
Arcidiacono and Lovenheim’s review of the BPS studies does, however, serve to remind us that wise policy is based not on whether relationships are statistically significant but on the magnitude of the effects found. For example, they tell us that, assuming selection on unobservables does not differ with race, “African American students at selective law schools are about 2.5 percentage points less likely to pass the bar than white students at selective law schools.”49 The difference, even if statistically significant, is small and may be attributable not to affirmative action but to factors like stereotype threat or the ability to devote time and money to cramming for the bar exam. More importantly, the difference is dwarfed by effects of law school quality. At BPS Tier 1 schools, for example, 75 percent of African Americans with index scores between the 40th and 60th percentile of the African American score distribution pass the bar, as do 92 percent of those with index scores between the 60th and 80th percentiles, and 90 percent of those with scores in the top 20 percent of the distribution. For BPS Tier 2 schools the pass rate for students in these quintiles is 54 percent, 67 percent and 86 percent respectively, while for tier 3 schools they are 65 percent, 77 percent and 82 percent.50 A 2.5 percent decrement vis-à-vis white students is a small price to pay for the bar passage advantage associated with attending an elite school.
The second study that Sander has been touting as resurrecting mismatch theory is by Scott Carrell et al.51 Carrell and his coauthors, who teach at the Air Force Academy, noted that low ability students, as measured by the SAT verbal test, “benefited significantly from being [randomly placed in squadrons] with peers who have high SAT Verbal scores,”52 an observation contrary to what mismatch theory would predict. They then designed an experiment that built on this observation. One set of incoming cadets (the controls) was assigned randomly to thirty-person squadrons following the Academy’s usual random assignment procedure. Other students (the experimental subjects) were assigned to thirty-person “bimodal squadrons.” These squadrons combined large numbers of low skilled and high skilled cadets as measured by SAT verbal test scores. The experimenters hypothesized that interaction between low and high ability cadets would, in accord with their earlier informal observations, work to benefit those with low ability. This was not what they found. Low ability students in the bimodal squadrons ended up with grades that, when compared to control group cadets, were below the grades they were predicted to receive, and differences were statistically significant. The authors, in retrospect, suggest that in the absence of middle ability students, the concentrations of high ability and low ability students within small groups resulted in interaction patterns that were homogenous with respect to skill levels. The result was that low ability students did not noticeably benefit from the presence of many high ability students within their squadrons.53
These results tell us little about the implications of affirmative action or mismatch in the real world. Affirmative action minorities have a range of measured skill levels and their white classmates also have a range of measured skill levels, overlapping with, though on average higher or even much higher than, the minority skill range. Furthermore, when students commence their college studies, neither minorities nor whites find themselves in dorms or classes populated by equal numbers of students with skills at the extremes and few who are in between. In addition, the effects Carrell and his coauthors found were not only barely significant statistically, but they were substantively unimportant. The mean grade decrement associated with bifurcation was .061 or the difference between a GPA of 2.26 and 2.2.
As we saw in Part II, numerous researchers have failed to find a counterproductive association between affirmative action and mismatch at the undergraduate level. If anything, being overmatched aids minority students. Hence the empirical case for mismatch has rested largely on studies of law students using the BPS data, mainly by Professor Sanders.54 As even a brief review reveals, these studies cannot be relied on.
IV. Science Desistence 55
A. Findings and Explanations
Opponents of affirmative action, perhaps frustrated because the social science consensus rejects the mismatch hypothesis, have latched onto science desistence, which they call “science mismatch” as an empirical bolster for their position. The science desistence argument is that affirmative action minorities who enter college planning a science, engineering, or mathematics major will be more likely to persist to a degree in one of these fields if their academic credentials are closer to those of their classmates. Unlike general mismatch claims, there are several empirical studies which, despite their limitations, report results consistent with this argument.56 There is also a plausible mechanism behind the claim. Low grades in science courses can discourage students from persisting in science majors and the more competitive one’s fellow students are, the harder it will be to attain high grades when classes, like many introductory science classes, are graded on a curve.
Claims regarding mismatch and science desistance receive their most substantial empirical support from the careful work of Smyth and McArdle.57 Using information pertaining to twenty-three of the schools in the C&B data set, Smyth and McArdle used a multilevel model to contrast the science persistence of affirmative action eligible minorities to that of whites and Asians.58 They found no statistically significant difference between minority and white persistence to science degrees when students were equally distant from their school’s mean SAT math score and high school GPA, although there remained a significant difference between the science persistence of minority and Asian students.59 This result implies that minority students would be more likely to graduate with science majors if, as a group, their mean academic skills and preparation were closer to those of their white science-interested counterparts.
The implication of these results for affirmative action admissions are, however, far from clear, even if the goal is to maximize the production of minority scientists. If minority students are more likely to graduate from more selective schools regardless of major, increases in science degree attainment attendant upon moving aspiring minority scientists from more to less selective schools will be attenuated, perhaps substantially. Thus in the C&B data set, 88 percent of African Americans with combined SAT scores under 1000 graduated if they attended a school in the top third in selectivity. This compares to a 65 percent graduation rate for students attending schools in the bottom third. For African American students with combined scores between 1100 and 1199, the graduation rate difference is 15 percent.60 A higher probability of graduating with a science degree conditional upon graduation could be more than offset by a lower probability of graduating at all.
Moreover, although abolishing affirmative action would reduce differences between white and minority admissions credentials, it would not eliminate them.61 Hence grade-driven differences in science persistence between whites and minorities would most likely remain. In addition, the schools in the C&B data set are, by national standards, all highly selective. As Smyth and McCardle recognize, their results will not necessarily generalize to schools much beyond the C&B selectivity range. Finally, Smyth and McCardle’s model only explains 10 percent of the variance in science major persistence. This leaves substantial room for changes in campus culture and science education to increase minority science persistence. If the goal is to increase the number of minorities receiving science degrees and the choice is between moving science-interested minorities to schools where their education may be less rigorous and their overall chances of graduating less likely, and making changes in how science is taught or increasing the number of science faculty of color, it is difficult to see why we should prefer the former.
This is reason enough to believe that even if the claimed association between affirmative action and science desistence is empirically grounded, its educational policy implications are far from clear. In particular, much of the white-minority science desistance gap may not reflect affirmative action, and to the extent it does amelioration does not necessarily require cutting back on affirmative action.
Policy analysis must begin by recognizing that many students who begin college with intended science majors switch to other majors regardless of whether they have benefitted from affirmative action. Amanda Griffith looking at twenty-eight selective schools in the National Longitudinal Study of Freshman (NLSF) data set found about a gap of about 10 percent between the likelihood a minority student who seemed initially interested in a science, technology, engineering, or math (STEM) major would persist to a science or engineering degree and the likelihood that a similarly interested nonminority student would persist. The gap may appear large but the persistence gap between men and woman was 6 percent, and this can hardly be explained by affirmative action.62 Hence mismatch of putative science majors is, at best, needed to explain only a fraction of minority science desistance and it is not the only possible explanation.
Conditioning on an intent to major in science may itself bias results because when minorities start college, they may know less than whites about what a science major entails and thus may be less committed to their apparent intentions. Griffith, for example, also finds that students who while in high school took more advanced placement (AP) science courses are more likely to persist to STEM majors. This may reflect not only better preparation but also a more informed view of what college science courses are like. In addition, AP credits may allow students to skip large introductory science courses where grades tend to be lower than those received by students in introductory humanities and social science courses. This too may explain part of the gap between minority and nonminority science desistence, as may other considerations, like the absence of same race role models, a sense of racial isolation in science classes, the attraction of fields like African Studies that seem of particular ethnic relevance, or enhanced stereotype threat when being tested in a field not popularly associated with minority successes. None of these explanations requires a resort to mismatch theory, either generally or in the science context.
There is also evidence suggesting that gaps between the science persistence of minorities and whites may be driven less by academic mismatch than by institutional mismatch, that is, differences in institutional cultures as reflected in student relationships and science teaching. Griffith’s NLSF data provides evidence that institutional culture matters. She was able to identify differences that influenced the likelihood that women and minorities would persist in science majors, such as the ratio of undergraduate to graduate students and the research funding a school’s faculty receives.63 Her findings suggest that if the nation is interested in producing minority scientists, it should push for changes in how schools teach science rather than using so-called science mismatch as a justification for rejecting affirmative action.
In short, there is empirical support for the claim that minorities who enter college with an interest in a STEM discipline are less likely than whites to persist to a STEM degree, but the support is limited and its extent unclear. Moreover, none of the studies examining minority science desistence indicates that abolishing affirmative action would increase the number of minorities who become scientists, although language in Arcidiacono et al. (discussed below) seems to carry this implication. In addition, the studies offering mismatch explanations all have limitations, including in the case of Elliot et al. and Smythe and McCardle small samples dominated by highly selective schools. Griffith, using two samples, one of which includes a larger number of schools, identifies an academic component to science desistance consistent with mismatch claims but she suggests that institutional culture most likely plays a larger role.
No study focusing on minority science desistence examines post college careers and, in particular, the pursuit of masters and Ph.D degrees. Even if a minority student at a highly selective school would be more likely to abandon an intended science major than if she had attended a less selective school, minorities who do graduate from selective schools may be more likely than similarly skilled minorities at less selective institutions to pursue graduate training. Liliana Garces’s research is suggestive. She looked at graduate science and engineering enrollments in four states in the several years before and after they abolished affirmative action. She found that the proportion of state school engineering degree enrollees who were minorities fell by 26 percent (from 6.2 percent to 4.6 percent) while in the natural sciences the drop was about 19 percent (from 7.8 percent to 6.3 percent).64 Later, writing with David Mickey-Pabello and looking at six states, she found that much the same was true of medical school enrollments.65 These declines occurred at a time when the country’s minority population, particularly its Latino population, was rapidly growing. The authors found no evidence indicating that these reductions were made up by state residents enrolling elsewhere.
B. Arcidiacono et al.
The most recent contribution to the science desistence literature and one likely to figure prominently in future debates is a forthcoming article by Peter Arcidiacono et al. in the American Economics Review (AER).66 AER focuses on outcomes at the eight University of California (UC) system universities during the three years (1995–1997) before California Proposition 209 ended affirmative action in that state. These schools vary greatly in their academic reputations and selectivity, ranging from UC Berkeley, where 64.3 percent of all white and Asian applicants had combined SAT scores that placed them in the top quartile of all UC system college applicants, to UC Riverside, where only 9.9 percent of the school’s applicants had scores in the same range. AER uses a data set that is rich with information on students admitted to UC schools, including whether as applicants they had expressed an interest in majoring in science.67 The data allow Arcidiacono et al. to compare the likelihood that an intended science major who attended UC Berkeley would persist to a science degree with an estimate of the likelihood that the same student would have persisted in science had (s)he gone to some other UC school. Generally speaking, AER finds that minority admittees who attended UCLA or Berkeley are less likely to graduate in five years with science majors than if they had attended one of the system’s lowest selectivity schools: Santa Cruz or Riverside.
There are, however, reasons to be skeptical about the weight that should be accorded to AER’s conclusions and even more reason to think that they have little bearing on the wisdom of affirmative action. Moreover, although the article was peer reviewed, AER’s peer reviewers were most likely poorly positioned to see substantive as opposed to methodological weaknesses. Most are visible only when AER is compared with an earlier version of the article that Arcidiacono and his colleagues posted on the web in 2013 (Arcidiacono 2013).68 The earlier version is sufficiently different from the forthcoming article that it is best seen not as a draft of AER but as a separate piece which reveals the sensitivity of AER to data choices, analytic approaches, and assumptions. A major difference in the versions is that in Arcidiacono 2013 adverse effects attributed to science mismatch are confined to students whom the authors place in the bottom quartile of all UC system applicants on likely academic ability. In contrast, in AER adverse effects are found for second quartile students as well. Furthermore, Arcidiacono 2013 hypothesized that science-interested students at UC San Diego, the system’s third most selective school, would, like their counterparts at UC Berkeley and UCLA, have been more likely to have completed science majors if they had instead attended Santa Cruz or Riverside. No significant increase was found. In AER, comparisons with San Diego are not highlighted. This allows Arcidiacono’s science mismatch hypothesis to appear more consistently supported.
The suggestion in AER but not Arcidiacono 2013 that second as well as bottom quartile students would have been more likely to persist in science majors had they attended Santa Cruz or Riverside most likely reflects two changes in the model used. The authors had data on both the ranges in which student SAT scores fell and on the California system’s academic preparation score, a linear combination of SAT scores and high school grades. In Arcidiacono 2013, the authors chose to use SAT scores to divide students into quartiles, but in AER they used UC preparation scores. Also in AER, but not in Arcidiacono 2013, they attempted to impute precise SAT scores to students rather than using midpoints of SAT ranges in their modeling efforts.
In both versions, Arcidiacono and his coauthors report four and five year graduation rates, but they apparently had six year graduation rates available as well. If the concern is how science desistence affects the production of minority scientists, it is unclear why science degrees received within six years were not counted as completed majors. Differences are not trivial. For example, during the years 1996 and 1997, six year graduation rates for African Americans were on average about 7.8 percentage points higher than five year graduation rates. This corresponds to a mean annual increase of 12.5 percent over the five year base.69 For Latinos, the average percentage point increase over these two years is 6.4, or a mean annual increase of 9.4 percent over the five year base.70 If it takes longer to complete science majors at more selective schools, using five rather than six year completion rates will bias the results in favor of finding evidence of mismatch. But even if bias is no threat, if the concern is to investigate the production of science majors, six year figures should have been included throughout.
There is nothing necessarily wrong with any of the changes in variables or methods that differentiate Arcidiacono 2013 and AER. The AER model may well be superior to that used in the earlier paper. Nonetheless, the differences between the two papers, none of which are mentioned in AER’s summary of robustness checks, have implications for the weight AER’s findings deserve. When hypotheses are tested in different ways, uncorrected significance tests may mislead because significant relationships have more than one chance to emerge. We know that at least two different models were tested and in only the forthcoming version were effects on second quartile students significant. Thus it appears that AER’s results are not robust to different ways in which initial skill levels might be measured.
Arcidiacono et al. in their AER introduction emphasize the importance of increasing the number of minority STEM majors. What they fail to realize is that even if their projections are correct and that academically weaker Berkeley and UCLA students would be more likely to persist in science majors at less competitive institutions, it does not follow that abolishing affirmative action would increase the number of minorities completing science majors even if the minority-white science desistence gap were in each school eliminated. Science-interested minorities who succeed in completing science degrees at UC schools might be in the system only because of affirmative action. If Santa Cruz and Riverside were the only UC schools that would admit those lower quartile science-interested minorities who now attend UC Berkeley or UCLA, many of the presumably less skilled lower quartile minorities at other UC schools might be unable to secure admission to any UC campus. Yet there are some in this group who completed science majors. So even if detrimental science mismatch effects exist, abolishing affirmative action could diminish the production of minority science majors even while increasing the probability that science-interested minorities graduate with science degrees. Arcidiacono et al. could have shed light on this tradeoff because they had outcome data for the years immediately following the ban on affirmative action in California. Rather than simply estimating the impact of abolishing affirmative action on the number of minority scientists, they could have told us what actually happened.
I was able to acquire data on graduation rates and numbers for the two years before and the four years immediately after the California ban on affirmative action.71 One set of figures relating to mismatch stands out. The average number of African Americans in each annual cohort who graduated from Berkeley within six years of entering fell from 175 per year prior to the ban to about 97 per year after the ban. At UCLA, these numbers dropped from about 171 to 111. The mean number of Latino graduates from Berkeley was about 306 for the two pre-ban cohorts, and fell to 258 for the cohorts entering between 1999 and 2001. At UCLA the drop was from 501 to 419, even though the population of Latino high school graduates was rapidly rising and UCLA increased its entering class size by about 11 percent over the four post-ban years. If minority students were mismatched at these elite schools due to affirmative action, one would expect the proportion of minorities graduating with degrees to rise substantially after the ban because students who were admitted at that point should have had academic credentials far closer to those of their white peers. In fact, the mean proportion of Berkeley’s African Americans admittees who graduated with degrees within six years barely rose, from 69.8 percent to 70.9 percent, while the comparable rise at UCLA was from 75 percent to 78.6 percent. Among Latino students, the rise in six-year graduation rates was from 73.1 percent to 74.4 percent at Berkeley and from 78.6 percent to 81.9 percent at UCLA. These are far below the gains that would be expected if Berkeley and UCLA’s affirmative action beneficiaries had been troubled by mismatch. The data I acquired did not indicate intended majors, so I cannot directly examine the issue that is the central focus of this Part. However, the minimal nature of the overall effects suggest that science specific effects are likely to be small.
C. The Data Viewed Differently
Arcidiacono et al.’s findings, even if reliable, have no clear policy implications because we know nothing about the number of minorities at Berkeley and UCLA who left intended science majors when they would have persisted had they attended less elite universities. It is numbers rather than percentages that matter most for policy purposes, since a treatment that harms (helps) five people is far less consequential than one that harms (helps) 500, even if in each case those constitute 50 percent of those exposed to the treatment. Arcidiacono et al., however, report percentages without indicating the numbers they are based on.
The information in AER does not allow one to reconstruct the numbers behind the percentages but this is possible with Arcidiacono 2013. Although the number of minority students in AER’s bottom two quartiles differ somewhat from those in Arcidiacono 2013 since students are placed into quartiles using different metrics, totals within quartiles do not differ greatly between the two studies, and quartile placements of students are certain to overlap substantially. Thus, numbers drawn from 2013 should be sufficiently similar to the relevant figures in AER to give us a good idea of what both the AER and Arcidiacono 2013 results imply for the production of minority scientists.
Table 1: Science Majors and Graduates UC Berkeley and UCLA (1995–97)
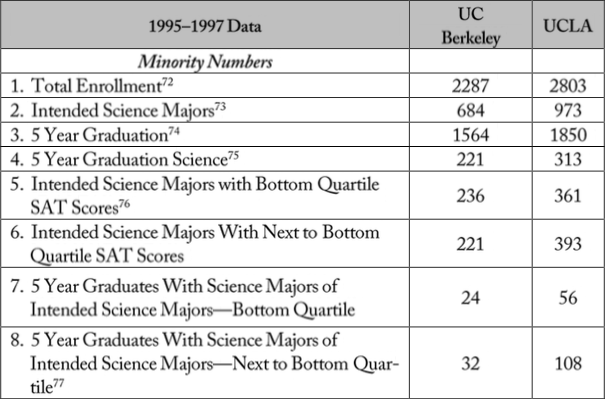
Table 1 estimates the number of minority students attending UC Berkeley and UCLA during the years 1995–97. As in AER and Arcidiacono 2013 these estimates are annualized, meaning that the number of affected minorities across the three years is three times as great. What is most striking is the relatively small number of minorities at UC Berkeley and UCLA who, each year, graduate after five years78 with degrees in science.79 At Berkeley they number 221 and account for a bit under 10 percent of the minorities who enroll. At UCLA, which has a larger total enrollment, 313 minority students, or about 11 percent of freshmen enrollees, graduate with degrees in a science.80 Minorities completing science majors are also a small fraction of all minority graduates, constituting about 14 percent of those obtaining degrees from Berkeley and about 17 percent of those graduating from UCLA.
These numbers, small as they are, shrink dramatically among those with the weakest entrance credentials. Only twenty-four of Berkeley’s minority students with SAT scores in the bottom quartile of UC system applicants receive degrees in the sciences. They account for about 11 percent of all minorities who graduate having majored in science. Second quartile science graduates number thirty-two, and account for about 14.5 percent of minority science degree graduates. Thus, minority students at Berkeley with SAT scores in the bottom half of the system’s applicant pool constitute only a quarter of minority science degree recipients, although they account for about 67 percent of Berkeley’s minority matriculants. These estimates may be low, however, for initially less well prepared students may require more time than others to get their degrees. If so, six-year graduation data would show a somewhat higher fraction of minority science degrees going to lower quartile students. But even allowing for this, the correlation between SAT scores and the likelihood that a science-interested minority student will graduate with a science degree appears substantial.
UCLA presents a different picture. Bottom quartile intended science majors account for about the same proportion of science degree awardees as second quartile Berkeley students, while second quartile UCLA students account for 27 percent of all UCLA science degree recipients. Even if we adjust the data to account for the fact that UCLA’s minority enrollment includes a higher proportion of first and second quartile students than Berkeley’s, differences in science degree completion remain. These differences are substantial (about 50 percent higher) in the case of UCLA’s second quartile students. Moreover, UCLA’s second quartile science-interested minorities graduate with science degrees with a probability that is only about 7 percent less than the probability that a third quartile science-interested student will graduate in a science, while Berkeley’s second quartile science-interested students are 23 percentage points less likely to graduate with science degrees than that school’s third quartile students. Moreover, these Berkeley students are 13 percent less likely to complete science majors than their UCLA counterparts, even though the latter should, on average, have slightly lower SAT scores.
There is a puzzle here. Berkeley and UCLA are both highly selective, outstanding research universities and although Berkeley’s students may be slightly stronger, UCLA’s undergraduate science curriculum is unlikely to be noticeably less rigorous than Berkeley’s, nor is the competition—below the very top—likely to be less stiff. What then can explain the difference between the way second quartile intended science majors perform at the two schools? The answer is likely to lie in the way the sciences are taught at the two schools and/or in the cultures of the two schools and the comfort that minorities feel on campus. Sheer numbers may also play a role. UCLA has considerably more minorities who, when they enter, intend to complete a science major (973 vs. 684). Hence UCLA’s introductory science classes are likely to contain larger numbers of minority students. The relevance is that if large persistence to degree differences can arise between similar schools like UCLA and Berkeley that do not differ substantially in the degree to which the academic credentials of their science-interested minorities fall short of their schools’ white intended science majors, then explanations other than so-called science mismatch, may explain any advantage in graduating scientists that minimally selective schools have over highly selective ones. A second point of relevance is the following: that if Arcidiacono et al.’s analysis of the negative effects of overmatch on minority science degree attainment were correct, and even if one accepted their questionable supposition that minorities are better served by getting science degrees from Santa Cruz or Riverside than they would be by completing humanities or social science majors at Berkeley or UCLA, numerically few students would be helped by attending the less selective schools, however striking or statistically significant percentage differences might seem.
Table 2: Implications of “Better” Science Matches
(Annualized Numbers of Students: 1995–97)
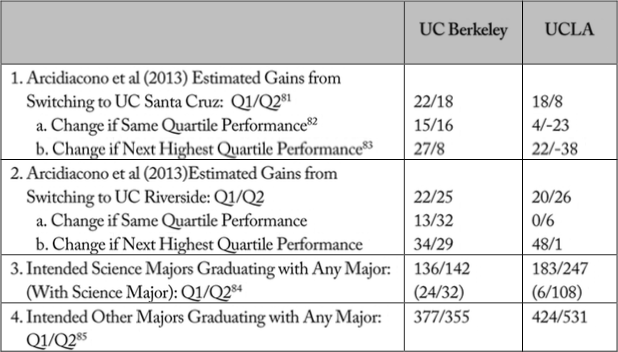
Table 2 builds on Arcidiacono 2013’s estimate of how science persistence would change if the science-interested minorities in Berkeley’s and UCLA’s bottom two quartiles had gone to Santa Cruz or Riverside instead. Percentagewise, the increase in the proportion of minorities completing science majors would be large in the case of Berkeley and modest in the case of UCLA but in both cases, as can be seen in Table 2 lines 1 and 2, the number of affected students is small. Translating Arcidiacono et al.’s percentages into numbers suggests that each year an additional twenty-two first quartile students would have received science degrees had they attended either Santa Cruz or Riverside instead of Berkeley, while eighteen additional second quartile students would have graduated with science degrees had they attended Santa Cruz, and twenty-five more would have completed science majors had they attended Riverside. At UCLA, predicted gains are less if students switch to UC Santa Cruz and comparable if they switch to Riverside.
Lines a and b below lines 1 and 2 are provided to set plausible bounds on Arcidiacono et al.’s estimates. Line a assumes that the UC Berkeley and UCLA switchers would succeed at the same rate as their quartile counterparts if they had started at the less selective schools and line b assumes that they would have performed at the same level as students in the quartile above them. To put this another way, the row b numbers estimate the gains in science major completion that would be expected if Berkeley and UCLA’s first (second) quartile science-interested minorities had started instead at Santa Cruz or Riverside and completed science majors at the same rate as second (third) quartile students at the latter schools. If Arcidiacono et al.’s estimates are trustworthy, the numbers they imply can be expected to fall within these bounds. Hypothetical first and second quartile Berkeley and UCLA switchers should have a higher probability of completing science majors than those in the same quartile at Santa Cruz and Riverside because Arcidiacono 2013’s estimates take into account the likelihood that the Berkeley and UCLA admittees are academically stronger in ways their data do not directly measure. Also because Arcidiacono 2013 allows sorting into quartiles only on the basis of a range in which a student’s SAT score falls, it is likely that within quartiles the mean SAT scores of Berkeley and UCLA minorities are higher than the within quartile means at Santa Cruz or Riverside. But absent unrealistically large selection effects, one would not expect first (second) quartile science-interested minorities at Berkeley and UCLA to have academically relevant skills that exceed those of second (third) quartile students at Santa Cruz and Riverside.86 Thus, hypothetically transferring science-interested minorities from Berkeley and UCLA to Santa Cruz and Riverside should produce estimates of science degree completion that fall between the two bounds.
However, in four out of eight instances the expectation that same and higher quartile success rates would bound the Arcidiacono et al. predictions does not hold. In three of the four instances, all involving second quartile students, Arcidiacono 2013’s predicted gains from switching appear implausibly high. In the two instances involving UCLA students, postulated gains in minority science degree completion are far beyond what they would be if second quartile UCLA students performed not as they did at UCLA but at the level of third quartile Santa Cruz and Riverside students. In the other instance, where first quartile Berkeley students are the hypothetical switchers, Arcidiacono et al.’s estimate suggests that Berkeley’s minority students would not quite reach the level of success that Riverside’s first quartile minorities enjoyed. Taken together, these results suggest that considerable error surrounds the Arcidiacono et al. estimates, and that on balance these errors are likely to overestimate the graduation gains that might accompany the elimination of so-called science mismatch.
D. The Irrelevance of Desistance Gaps
Even if these empirical critiques could not be made, there are reasons to deny so-called science mismatch any place in the affirmative action debate. One reason is libertarian and another turns on the price of avoiding science mismatch and who pays. The science desistance argument says that if a lower skilled minority student aspires to a degree in science, that student would be well advised to attend a minimally selective university. This is not because the student would necessarily fail to receive a science degree at an elite school like Berkeley or UCLA but because the student would have a higher probability of receiving a degree in science at a less elite school like Santa Cruz or Riverside. But who should determine whether to prefer the higher payoff option or the option with the higher likelihood of success? To argue against affirmative action because the country needs more science-trained minorities is to say that society, rather than affected students, should determine the quality of the school the student attends. To foreclose a student’s chance of admission to an elite school because the country needs more minorities with degrees in science is to argue that a minority student’s educational preferences should be overridden for the good of the collective. One might argue that society knows what is best for the student and should mandate it or that the nation has a right to insist that minorities graduate college with degrees that best fit society’s needs. These claims however, are never so baldly made in discussions of affirmative action because they would not persuade. Yet, the arguments of those who invoke science mismatch in making a case against affirmative action rest on one or both propositions.
Arcidiacono et al. in AER and those who agree with them argue that science-interested minorities will be better off and that society will benefit if the students’ option to attend an elite school and attempt a science major is foreclosed. My view is different. Even if credential disparities indicate that minorities have an elevated risk of science desistence, the most we should do is inform minority students of what the data look like. These students should then be allowed to choose which path they want to follow, and paths to more selective schools should not be closed under the pretense that students are being helped by the abolition of affirmative action.
Moreover, even if it were acceptable to paternalistically insist that minorities attend schools where they are more likely to complete science degrees, we should not do so without recognizing the price to be paid. We would be making large numbers of minority students worse off to enable a small number of minority students to attain science degrees that they would otherwise not complete. Lines 5 and 6 in Table 2 use Arcidiacono 2013 estimates to show tradeoffs within the California system. I shall focus on the benefits of transferring to Riverside, which according to these estimates would do the most to increase minority science degree earners, regardless of a student’s admissions quartile and her current school. We see from the table that forty-seven science-interested Berkeley students (twenty-two with first quartile SAT scores and twenty-five with second quartile SAT scores) who now fail to get degrees in science are predicted to receive them if they attend Riverside instead. But if these students could only secure admission to UC Riverside because of a ban on affirmative action, the same would presumably be true of their fellow lower quartile classmates. Thus to benefit these forty-seven students, assuming students are better off with science degrees from a low prestige institution than they would be with a different degrees from high status institutions, 68587 minority students would also have to trade in their prestigious Berkeley degrees for far less prestigious Riverside diplomas. Even if we could manage to only channel science-interested students away from Berkeley to Riverside, we would be hurting far more than we would help. In that case, enabling forty-seven extra science degrees requires that 231 minority students be content with a Riverside degree when they could have graduated from Berkeley. This is because, for reasons other than postulated mismatch, most science-interested minority students, like many if not most science-interested white students, switch majors to fields other than science before they graduate. Moreover, fifty-six of the students who would presumably have graduated from Riverside with science majors would have graduated with similar degrees from Berkeley had they not failed to gain admission due to an affirmative action ban. Surely training for a science at Berkeley rather than at Riverside would have brought with it considerable advantages, including perhaps research opportunities with some of the country’s most distinguished scientists and a headstart on the path to a top graduate school.
The situation at UCLA is similar, except more students would pay costs relative to the number who would benefit. Only forty-six more minorities would be expected to complete science majors in this hypothetical world, but 909 minority students would graduate with degrees labeled Riverside rather than UCLA. If only intended science majors were channeled to Riverside, then 384 other minority students would have to trade in their UCLA degrees for Riverside degrees. Moreover, 164 of these status losers would have successfully completed science majors had they been admitted to UCLA. Combining the two elite schools, each year ninety-three minority students who currently do not finish science degrees would be expected to do so, but 1731 minority students would be denied prestigious Berkeley and UCLA diplomas, including 220 who would have graduated from one of these schools with a science major. If Berkeley and UCLA’s first and second quartile minorities went to Santa Cruz rather than Riverside, even fewer science-interested minorities would be expected to benefit, while a few more minority students would be denied a more prestigious degree.
Neither this speculative exercise nor the Arcidiacono et al. projections speaks to what matters most: the quality of the education minority students receive. If school prestige and selectivity correlates with the quality of a student’s peers, course rigor, and the standards a school sets for its students, minority students would lose not just degree prestige and the post-college opportunities it can bring; their education, both informally from peers and formally from professors, would also suffer. Even if one finds in the Arcidiacono et al. data some support for the science mismatch hypothesis, that support translates into advantages for relatively few students, while many more minorities, including most who enter college intending science majors, would lose out. This empirical reality together with the libertarian and social choice arguments described above are why I have argued that so-called science mismatch, even if theoretically interesting and worth studying, has no legitimate role to play in the affirmative action debate. Rather, as briefs in Fisher II case indicate, it is a rhetorical tool deployed by foes of affirmative action to allow themselves and others to oppose affirmative action while maintaining a façade of concern for the education of minorities and their place in American society.88 Science mismatch is little more than a new hook on which to hang the case against affirmative action.
Although AER is unlike Arcidiacono 2013 in that I cannot reproduce the numbers behind the percentages provided, AER’s estimates of the gains to be had from moving science-interested Berkeley and UCLA students to Santa Cruz and Riverside are almost certain to translate into similarly small numbers. The estimated percentage gains in the science graduation rates of intended science majors in the two papers are for the most part close,89 and in some cases are higher in the earlier version. Moreover, using SAT scores rather than the California admissions readiness score to place minority students into quartiles increases the number of lower quartile minority students, meaning that where the percentage increases estimated in AER are only slightly higher than those in 2013, the number of affected students might well be the same.
What AER adds to Arcidiacono 2013 beyond what can be seen as sensitivity checking using a different model is an estimate of how the distribution of intended minority science majors would change if science-interested minorities were assigned to UC system campuses in the way whites are assigned. This provides a more realistic assessment of the effects of ending affirmative action, since without affirmative action not every first or second quartile minority student would end up at one or the other of the least selective UC campuses. AER Table 8 shows that so-called race-neutral assignment would dramatically reduce the number of science-interested minorities admitted each year to the most selective UC campuses. At Berkeley the drop would be from about 629 students to 128 students, while at UCLA the reduction would be from about 930 intended science majors to 204.90 Assuming that the minorities who attended Berkeley and UCLA under race-neutral assignment would be no more likely to switch majors than nonminority students, the proportionate fall off in the number of students completing science majors would decline. Berkeley would be graduating seventy-nine minority science majors each year compared to 219 with affirmative action and UCLA would be graduating 120 minority science majors each year compared to 390. Numerically, one could expect to see proportionally similar if not greater drops in the number of admitted minorities with no interest in science. UC San Diego and UC Davis would also see drops in their share of minorities who entered college intending to major in a science, although at Davis the drop would be minuscule and its share of minorities not intending science majors would rise. The four least selective UC campuses would all have a higher share of the system’s minorities who enter with intended science majors, with UC Irvine enjoying by far the greatest gain.
There is, however, a problem with this picture. It is too optimistic. In AER, Arcidiacono et al. assign all of the data set’s science-interested minorities to some UC campus. Although it is most likely safe to assume that without affirmative action the science-interested minorities at Berkeley and UCLA would qualify for admission at some UC campus, this is unlikely to be true of those minorities who, even with a boost from affirmative action, were admitted only to the system’s least selective schools. Some of these students graduated with science majors despite their apparently poor preparation. They might still do so at private schools or out of state public institutions, but most likely some would fall by the wayside and would never enter the science-trained workforce. AER fails to account for these dropouts in its attempts to estimate the consequences of ending affirmative action for minority science production.
Putting this objection aside, Arcidiacono et al.’s effort to reassign minority students on the same basis as nonminorities is consistent with Table 2’s portrait of the limited effect that abolishing affirmative action would have on the production of minority science graduates. AER Table 9 indicates that if minorities were assigned to campuses in the way nonminorities are assigned, minority science degree completion rates would increase system wide by between 1.06 and 1.98 percentage points, depending on the students’ academic preparation quartile. Using the highest estimated increase (1.98 percentage points) which applies to second quartile students, it appears that race-neutral assignment across the UC system would dramatically reduce the presence of minorities at Berkeley and UCLA, but yield a net gain of only eleven science degree holders from among those science-interested minority students who, with the benefit of affirmative action, were able to matriculate at either Berkeley or UCLA. Moreover, using AER’s quartile specific increases, it appears that the number of first and second quartile students receiving science degrees would increase system wide by only four, and it is likely that no low quartile students who currently graduate with science majors from Berkeley or UCLA would have a degree from these schools after reassignment. These estimates are perhaps low because mismatch theory might lead one to expect that lower quartile science-interested students at Berkeley and UCLA would benefit more than the average minority student from race-neutral reassignment. But under no plausible scenario could the increase in minority science graduates from these schools be substantial. Indeed, if one takes the science graduates from all the UC system schools and increases their numbers by 1.98 percentage points, only twenty-seven additional science-interested students system wide will have graduated with degrees in science within five years of matriculating.91 Moreover, this number errs on the high side because the increases for third and fourth quartile students are 1.68 and 1.06 respectively, lower than the multiplier I have used, and students with preparation scores in these quartiles most likely constitute the bulk of the UC system’s minority science degree graduates. The greatest numerical change would be in the prestige of the institutions from which minority science majors gain their degrees. The number of minority students with science degrees from the system’s most selective schools would drop sharply, while the number of students with science degrees from the system’s least selective schools would rise significantly. Overall, one should expect the California system to be graduating fewer rather than more minority science majors because a number of minorities who might seek to major in science would be admitted nowhere.
Arcidiacono et al.’s two simulation studies yield results that are consistent with, but do not prove, a very modest degree of science mismatch. Effects are so modest that even in a system as large as California’s university system, only a small number of science-interested minority students are predicted to benefit from being channeled by an affirmative action ban to less selective schools. Far larger numbers of minority students, including most intended science majors, would pay the costs of receiving a less prestigious degree and perhaps less rigorous training. Banning affirmative action would, in addition, most likely reduce the system’s production of minority science majors rather than enhance it because any gain in minorities persisting to a degree is almost certain to be offset by the number of students who would be admitted to no UC school without affirmative action. We should not, however, have to guess at whether eliminating affirmative action would increase or reduce the California system’s production of minority science degree holders. Arcidiacono et al. had data comparable to what they rely on in their study for the three years after California abolished affirmative action. These data which reflect the ban’s actual effects would tell us how race-neutral assignments affected the UC system’s production of minority science majors, at least in the short run. No model, no matter how sophisticated, can provide a better estimate.
Conclusion
This article reviews much of the empirical literature that has been central in advancing the academic mismatch hypothesis and its science desistance variant. It is not, however, a meta-analysis. I have not tried to canvas every relevant study and thus have missed some. Where I don’t discuss relevant studies it is either because I am unaware of them or because I thought their findings were redundant with the results of studies I do describe. In no case did I purposely omit a study because its results challenge conclusions I reach. These conclusions are:
(1) The empirical literature provides no evidence that affirmative action minorities are harmed due to academic mismatch. No sound science shows adverse effects to academic overmatch. To the extent mismatch has any effect at all, it appears that, except with respect to course grades, being overmatched is more likely to help minority students than to hurt them. While harm to individual students from mismatch cannot be excluded, any harm to some students appears offset, if not far outweighed, by benefits to others.
(2) There is a plausible mechanism that may depress persistence in science majors by science-interested affirmative action minorities. There are also empirical studies that support the so-called science mismatch hypothesis. The hypothesis is, however, far from proven. Most minority desistance from science majors can be explained by factors other than mismatch, for minority students share with all students a strong tendency to drop intended science majors. Although minority science desistance is elevated relative to whites, overmatch is but one of many factors that can explain this, and it has not been shown to be a particularly important one. Gender-associated differences in science desistance caution against giving much weight to affirmative action as a cause. Regardless of whether science mismatch to some degree exists, there is little reason to think that affirmative action reduces the number of minorities who receive degrees in or pursue careers in the sciences, engineering, or mathematics. The opposite is more likely to hold true. Science mismatch effects, if they exist, are likely to affect a relatively small number of minority students, indeed, a number that is most likely smaller, and perhaps far smaller, than the number of minorities who without affirmative action would be denied admission to schools that can prepare them for successful careers in science. If increasing the number of minority scientists is the goal of those purportedly troubled by high rates of minority science desistence, changing school cultures and the way the sciences are taught is far more likely to add minorities to the science workforce than abolishing affirmative action.
(3) So-called science mismatch has little relevance to the affirmative action debate. It would be relevant only if society has a right to insist that some science-interested minority students raise the odds that they will graduate with science majors by attending less selective schools than those they aspire to attend. Society has no such right. What can be done, and a reason to continue research into science desistance, is to inform students interested in science of their chances of completing a science major at the different schools they might attend. With this information, students can decide where to matriculate. Ensuring they choose a higher probability route to a science degree is not a reason to abolish or retreat from affirmative action. Nor would it be if the evidence supporting such assurance were stronger, or if other minority students, including science majors, did not have to sacrifice educational quality and the prestige of their degree so that some would have a better chance of graduating with degrees in a science.
(4) The evidence indicates that holding the degree of apparent mismatch constant, schools differ considerably in the graduation rates of their affirmative action admittees and in the likelihood that minorities who enter college contemplating a science major will graduate with a degree in science. Analyses focusing on whether minorities are mismatched at best explain only a small portion of success rate variance. The locus of research should not be on whether mismatch or science mismatch effects exist, but rather on what those schools with the highest minority graduation rates and the highest science degree persistence rates do well. This is the research path taken by those whose aim is to see minorities succeed in college but ignored by those who seek simply to discredit affirmative action.
1. See generally Lempert et al., Michigan’s Minority Graduates in Practice: The River Runs Through Law School, 25 L. & Soc. Inquiry 395 (2000).
2. Brief Amicus Curiae for Richard Sander in Support of Neither Party, Fisher v. Univ. of Tex. at Austin, No. 14-981 (U.S. Sept. 10, 2015).
3. Brief Amicus Curiae of Gail Heriot and Peter N. Kirsanow, Members of the United States Commission on Civil Rights in Support of Petitioner, Fisher v. Univ. of Tex. at Austin, No. 14-981 (U.S. Sept. 9, 2015).
4. Social scientists recognize two ways in which mismatch can occur. One is “undermatch” where a student attends a school well below the quality of the best school that the student, unaided by affirmative action, might attend. The other is “overmatch,” where a student attends a school where most students have academic credentials far above those of the student. When “mismatch” is used without qualifiers as in “mismatch theory” it is referring to situations where students are overmatched. Recent research suggests that large and relatively equal proportions of college students are mismatched in one direction or the other. However, contrary to what the existence of race-based affirmative action might seem to suggest, overmatch is more common among better off students, while undermatch is a more serious problem for the worse off. Eleanor Wiske Dillon & Jeffrey Andrew Smith, The Determinants of Mismatch Between Students and Colleges, (Nat’l Bureau of Econ. Research Working Paper No. 19286, 2013), http://www.nber.org/papers/w19286? utm_campaign=ntw&utm_medium=email&utm_source=ntw.
5. Early beneficiaries of affirmative action were almost entirely African American. While I focus my remarks mainly on African Americans, almost everything I say and report will apply to the other most frequent beneficiaries of racial or ethnic affirmative action—Hispanics and Native Americans—as well.
[6]. See, e.g., Clyde W. Summers, Preferential Admissions: An Unreal Solution to a Real Problem, 2 U. Tol. L. Rev. 377 (1970); Stephan Thernstrom, The Black-White Student Mismatch Problem in University Admissions, 6 J. Blacks in Higher Educ. 62 (1995); Stephan Thernstrom & Abigail Thernstrom, Reflections on The Shape of the River, 46 UCLA L. Rev. 1583 (1999).
[7]. For a more complete discussion, see generally William C. Kidder & Richard O. Lempert, The Mismatch Myth in U.S. Higher Education: A Synthesis of Empirical Evidence at the Law School and Undergraduate Levels, in Affirmative Action and Racial Equality: Considering the Fisher Case to Forge the Path Ahead 105 (Uma M. Jayakumar et al. eds., 2015); William C. Kidder & Angela Onwuachi-Willig, Still Hazy After All These Years: The Data and Theory Behind “Mismatch”, 92 Tex. L. Rev. 895 (2014) (reviewing Richard Sander & Stuart Taylor, Jr., How Affirmative Action Hurts Students It’s Intended to Help, and Why Universities Won’t Admit It (2012)).
[8]. William G. Bowen & Derek Bok, The Shape of the River: Long-Term Consequences of Considering Race in College and University Admissions (1998).
[9]. Id. at 59.
[10]. Id. at 61.
[11]. Mary J. Fischer & Douglas S. Massey, The Effects of Affirmative Action in Higher Education, 36 Soc. Sci. Res. 531, 544 (2007); see also Douglas S. Massey & Margarita Mooney, The Effects of America’s Three Affirmative Action Programs on Academic Performance, 54 Soc. Problems 99, 114 (2007).
[12]. Fischer & Massey, supra note 11, at 544.
[13]. Id.
[14]. Id. at 541.
[15]. Mario L. Small & Christopher Winship, Black Students’ Graduation From Elite Colleges: Institutional Characteristics and Between-Institution Differences, 36 Soc. Sci. Res. 1257, 1272 (2007).
[16]. Id. at 1257 (emphasis added). For other results indicating that minorities benefit from affirmative action, see generally Thomas J. Kane, Racial and Ethnic Preferences in College Admissions, in The Black-White Test Score Gap 431 (Christopher Jencks & Meredith Phillips eds., 1998); Peter Arcidiacono & Cory Koedel, Race and College Success: Evidence from Missouri, 6 Am. Econ. J. Applied Econ. 20 (2014).
[17]. Bowen & Bok, supra note 8, at 381.
[18]. Sigal Alon & Marta Tienda, Assessing the “Mismatch” Hypothesis: Differences in College Graduation Rates by Institutional Selectivity, 78 Soc. Educ. 294, 297 (2005); see also Eleanor Wiske Dillon & Jeffrey Andrew Smith, The Consequences of Academic Match Between Students and Colleges (IZA Discussion Paper Series, Paper No. 9080, 2015), http://ftp.iza.org/dp9080.pdf. Their article abstract summarizes their results: “We find little evidence to support the ‘mismatch’ hypothesis . . . . All students benefit from attending higher quality colleges.” Id.
[19]. Alon & Tienda, supra note 18, at 303.
[20]. Tatiana Melguizo, Quality Matters: Assessing the Impact of Attending More Selective Institutions on College Completion Rates of Minorities, 49 Res. in Higher Educ. 214, 232 (2008); see also Tatiana Melguizo, Are Students of Color More Likely to Graduate From College If They Attend More Selective Institutions?: Evidence From a Cohort of Recipients of the Gates Millennium Scholarship Program, 32 Educ. Evaluation & Pol’y Analysis 230 (2010).
[21]. See generally Kalena E. Cortes, Do Bans on Affirmative Action Hurt Minority Students? Evidence From the Texas Top 10% Plan, 29 Econ. Educ. Rev. 1110 (2010).
[22]. Id. at 1110.
[23]. See generally Stacy B. Dale & Alan B. Krueger, Estimating the Effects of College Characteristics Over the Career Using Administrative Earnings Data, 49 J. Hum. Resources 323 (2014).
[24]. Id. at 350.
[25]. See generally Lempert et al., supra note 1.
[26]. A look into the careers of medical school graduates over a twenty-year period yielded similar findings. See Robert C. Davidson & Ernest L. Lewis, Affirmative Action and Other Special Consideration Admissions at the University of California Davis School of Medicine, 278 JAMA 1153, 1153 (1997).
[27]. For a compendium of Sander’s studies and arguments for mismatch, see Richard Sander & Stuart Taylor, Jr., Mismatch: How Affirmative Action Hurts Students It’s Intended to Help, and Why Universities Won’t Admit It (2012).
[28]. Kidder & Lempert, supra note 7, at 113.
[29]. An earlier draft of this paper discussed in detail justifications for this conclusion but space limitations prevent a similarly detailed discussion here.
[30]. See generally David L. Chambers et al., The Real Impact of Eliminating Affirmative Action in American Law Schools: An Empirical Critique of Richard Sander’s Study, 57 Stan. L. Rev. 1855 (2005).
[31]. See Jesse Rothstein & Albert H. Yoon, Affirmative Action in Law School Admissions: What Do Racial Preferences Do?, 75 U. Chi. L. Rev. 649, 712 (2008).
[32]. See generally Ian Ayres & Richard Brooks, Does Affirmative Action Reduce the Number of Black Lawyers, 57 Stan. L. Rev. 1807 (2005).
[33]. See generally Gregory Camilli et al, The Mismatch. Hypothesis in Law School Admissions, 2 Widener J.L. Econ. & Race 165 (2011).
[34]. See generally Gregory Camilli & Kevin G. Welner, Is There a Mismatch Effect in Law School, Why Might It Arise, and What Would It Mean?, 37 J.C. & U.L. 491 (2011).
[35]. See generally Daniel E. Ho, Comment, Why Affirmative Action Does Not Cause Black Students to Fail the Bar, 114 Yale L.J. 1997 (2005).
[36]. See generally Alice Xiang & Donald B. Rubin, Assessing the Potential Impact of a Nationwide Class-Based Affirmative Action System, 30 Stat. Sci. 297 (2015).
[37]. Brief on Empirical Scholars as Amicus Curiae in Support of Respondents, Fisher v. Univ. of Tex. at Austin, 133 S. Ct. 2411 (2013) (No. 11-345).
[38]. Id. at 27.
[39]. See generally Kidder & Lempert, supra note 7.
[40]. See Brief Amicus Curiae for Richard Sander in Support of Neither Party, supra note 1, at 21–22.
[41]. Peter Arcidiacono & Michael Lovenheim, Affirmative Action and the Quality-Fit Tradeoff (Jan. 15, 2015) (unpublished manuscript), http://public.econ.duke.edu/~psarcidi/aa.pdf.
[42]. See generally Scott E. Carrell et al., From Natural Variation to Optimal Policy? The Importance of Endogenous Peer Group Formation, 81 Econometrica 855 (2013).
[43]. Brief Amicus Curiae for Richard Sander in Support of Neither Party, supra note 1, at 21–22 (quoting Arcidiacono & Lovenheim, supra note 41, at 69).
[44]. Arcidiacono & Lovenheim, supra note 41, at 69.
[45]. Id. at 24.
[46]. See id. at 26.
[47]. See id. at 28.
[48]. See Xiang & Rubin, supra note 36. This study is of particular importance because Rubin is a National Academy of Science member and one of the country’s most distinguished social science methodologists.
[49]. Arcidiacono & Lovenheim, supra note 41, at 27.
[50]. Chambers et al., supra note 30, at 1884.
[51]. Carrell et al., supra note 42.
[52]. Id. at 855.
[53]. One cannot conclude that the low ability students failed to benefit from the presence of high ability counterparts because the only control group was heterogeneous with respect to ability. To determine whether low ability students in bimodal squadrons benefited from the presence of high ability squadron mates, one would want a control group composed entirely of low ability students.
[54]. The other Bar Passage Study (BPS) data that is most often cited is an article by Professor Sander’s erstwhile coauthor Doug Williams. See generally Doug Williams, Do Racial Preferences Affect Minority Learning in Law Schools?, 10 J. Empirical Legal Stud. 171 (2013). Williams study could not be better designed to take advantage of the biases in the BPS tier structure, for his principal analysis combines students at tier 1 and 2 schools and compares them with students at tier 5 and 6 schools. Students at tier 3 and 4 schools, more than half the minority sample, are omitted. For a detailed critique of Williams’s article, see Kidder & Lempert, supra note 7.
[55]. When I refer to the sciences or to STEM in what follows I mean to include all the STEM (Science, Technology, Engineering and Mathematics) disciplines except the social sciences.
[56]. See, e.g., Peter Arcidiacono et al., University Differences in the Graduation of Minorities in STEM Fields: Evidence from California, 106 Am. Econ. Rev. 525 (2016), http://public. econ.duke.edu/~psarcidi/stem.pdf [hereinafter Arcidiacono et al. (AER)]; Peter Arcidiacono et al., University Differences in the Graduation of Minorities in STEM Fields: Evidence From California 1–44 (NBER Working Paper Series, Working Paper No. 18799, 2013), http://www.nber. org/papers/w18799.pdf [hereinafter Arcidiacono et al. (2013)]; Rogers Elliott et al., The Role of Ethnicity in Choosing and Leaving Science in Highly Selective Institutions, 37 Res. Higher Educ. 681 (1996); Frederick L. Smyth & John J. McArdle, Ethnic and Gender Differences in Science Graduation at Selective Colleges With Implications for Admission Policy and College Choice, 45 Res. Higher Educ. 353 (2004); see also infra note 56 and accompanying text.
[57]. See generally Smyth & McArdle, supra note 56.
[58]. Id. at 353, 359.
[59]. Id. at 371–76.
[60]. See Bowen & Bok, supra note 8, at 61.
[61]. Because of the way test scores of minorities and whites are distributed, if a school admitted all science-interested applicants with SAT scores above 650 in mathematics and only those applicants, the mean SAT math scores of white admits would still be higher than those of the school’s minority admits, and the scores of the minority admits would be clustered toward the low end of the 650–800 math SAT distribution.
[62]. Amanda L. Griffith, Persistence of Women and Minorities in STEM Field Majors: Is It the School That Matters?, 29 Econ. of Educ. Rev. 911 (2010). Griffith also examined respondents to the National Educational Longitudinal Study (NELS). In the NELS data set, the desistance rate difference between minorities and nonminorities is larger, about 16 percent, while the gender gap is only about 4 percent. The NELS, however, unlike the National Longitudinal Study of Freshmen (NLSF), did not oversample minorities, so it contained few science-interested minorities to begin with. Moreover NELS schools were far less selective than those in the NLSF, providing perhaps further reason to believe that minorities benefit when affirmative action enables them to enter elite schools.
[63]. Id. at 18, 21.
[64]. Liliana M. Garces, Understanding the Impact of Affirmative Action Bans in Different Graduate Fields of Study, 50 Am. Educ. Res. J. 251, 274 (2013).
[65]. See Liliana M. Garces & David Mickey-Pabello, Racial Diversity in the Medical Profession: The Impact of Affirmative Action Bans on Underrepresented Student of Color Matriculation in Medical Schools, 86 J. Higher Educ. 264, 264 (2015).
[66]. See Arcidiacono et al. (AER), supra note 56. When I use the acronym “AER” in what follows, I shall be referring to the Arcidiacono et al. article and not to the American Economics Review journal.
[67]. About 19 percent of the minority students who had expressed an interest in majoring in science when they applied to one UC school indicated a different area of interest when applying to another UC campus. See id. at n.20 Arcidiacono treats these students as intended science majors, and does not look at them separately to see if they are disproportionately likely to major in fields other than science.
[68]. See generally Arcidiacono et al. (2013), supra note 56.
[69]. See Graduation Rates Detail for University of California, Riverside, Cal. Postsecondary Educ. Comm’n, http://www.cpec.ca.gov/StudentData/GradRatesDetail.asp?ID=A0005A&Year=1999 [https://perma.cc/J5QX-FABH] (last updated 2011). In both the AER and 2013 versions of their article, Arcidiacono et al. also include students entering school in 1995 in their analysis but my Internet search did not yield comparable 1995 data. See Arcidiacono et al. (AER), supra note 56, at 3; Arcidiacono et al. (2013), supra note 56, at 4.
[70]. See Graduation Rates Detail for University of California, Riverside, supra note 69. Increases in degrees granted tend to be less at other UC schools, usually averaging between 4 and 6 percentage points.
[71]. See Graduation Rates Detail for University of California, Riverside, supra note 69.
[72]. See Arcidiacono et al. (2013), supra note 56, at 7 tbl.1. All figures are on an annual basis.
[73]. See id. (calculating figures as follows: Percent Initial Major Science x Total Enrollment).
[74]. See id. (calculating figures as follows: Percent 5 Year Graduation x Total Enrollment).
[75]. See id. (calculating figures as follows: Percent 5 Year Graduates With Science Majors x Number of 5 Year Graduates). Note the number includes a few students who did not enter with an intent to major in science but who graduated with a degree in a science.
[76]. See id. at 12 tbl.3 (calculating figures as follows: percent Students in Quartile x Number of Intended Science Majors). These figures are based on the assumption that the proportion of intended science majors in a quartile is the same as the proportion of all students in that quartile. This assumption very likely overstates the number of intended science majors in the lowest quartiles since, consistent with data in Arcidiacono et al. (2013), it seems likely that intended science majors will have stronger academic credentials than other entering students. See id. at 10 tbl.2. In context this assumption is conservative because it will lead to overestimates of the number of students apparently harmed by alleged mismatch effects. Second quartile figures are calculated in the same way.
[77]. See id. at 14 tbl.4 (calculating figures as follows: Percent of Intended Science Majors in Quartile Graduating in 5 years x Number of Intended Science Majors in Quartile). Calculations are similar for Next to Bottom Quartile Intended Majors.
[78]. I have not examined the four-year graduation rate data. If we are interested in the production of minority scientists, whether a degree is received in four or five years is of little consequence.
[79]. The word “science” as used by Arcidiacono et al. refers to engineering and mathematics, including statistics as well as the classic sciences. Peter Arcidiacono et al., Online Appendix: University Differences in the Graduation of Minorities in STEM Fields: Evidence From California, at 2 app. A, https://www.aeaweb.org/aer/app/10603/20130626_app.pdf. It also, perhaps problematically, includes “Movement Science,” a name sometimes given to Kinesiology and/or Exercise Science. While Kinesiology is a scientifically rigorous field, there was a time at my school, the University of Michigan, when some Kinesiology Department courses were alleged to have disproportionately attracted athletes. This may have been because the field related directly to issues of great interest to athletes but it also happened because, whatever the overall scientific strength of the Department’s offerings, some of its courses were known to be not particularly rigorous. The number of minorities in Arcidiacono et al.’s data who intend to major in science is sufficiently small and minority athletes at UCLA and Berkeley are sufficiently likely to fall into the bottom academic quartile of the students admitted to these schools that if many of them expressed an interest in a Movement Science major when applying, their failure to achieve degrees within five years, or their decisions to switch to other majors, could distort Arcidiacono et al.’s results. This may or may not be a problem. A quick internet search indicates that most if not all UC schools do not have Kinesiology departments, but perhaps some did twenty years ago. Even if they didn’t, it might still have been possible to express a pre-enrollment interest in, or construct a major in, this field. If Movement Science were not a potential major or area of concentration at at least some UC schools, it would not have been a category in the UC system data. I doubt if it would have affected their results, but Arcidiacono et al. (2013) would have been well advised to exclude Movement Science majors from their data base or to do a sensitivity analysis to see if its inclusion mattered.
[80]. Some minority students who enter college intending to major in something other than science switch to a science major and graduate with a degree in a science. These students are ignored in Tables 1 and 2 and in my discussion. This is not just because their numbers are tiny, but also because Arcidiacono et al. focuses on the desistence rates of students who entered college intending a science major.
[81]. See Arcidiacono et al. (2013), supra note 56, at 35 tbl.11 (calculating figures as follows: Estimated Percent 5 Year Graduation Gain by first (second) Quartile Intended Science Majors From Switch x Number of Intended Science Majors in Quartile). Gains for switches to Riverside are similarly estimated. The gains from switching are based on Arcidiacono et al.’s estimates. Comparing actual graduation rates, see id. at 14 tbl.4, with estimated base rate graduation rates, see id. at 35 tbl.11 reveals that in three of the four possible comparisons estimated rates are higher than actual rates. The only gains that are likely to be misleadingly high, however, are for second quartile Berkeley students, 14.6 percent of whom graduated with science degrees although 20.8 percent are expected to have graduated with such degrees according to the Arcidiacono et al. (2013) model.
[82]. Assumes that first quartile science-interested UC Berkeley and UCLA students had the same probability of graduating with a science degree as first quartile UC Santa Cruz science-interested students and that second quartile UC Berkeley and UCLA science-interested students had the same probability of graduating with a science degree as second quartile science-interested UC Santa Cruz students. See id. (calculating figures as follows: tbl.4 x line 5 (6) tbl.1 minus line 7 (8) tbl.1). Figures for UC Riverside are similarly calculated.
[83]. Assumes that first quartile UC Berkeley and UCLA science-interested students would do as well in graduating from Santa Cruz as current second quartile science-interested Santa Cruz students and second quartile UCB and UCLA science-interested students would do as well as current third quartile science-interested Santa Cruz students. See id. (calculating figures as follows: tbl.4 x line 5 (6) tbl.1 minus line 7 (8) tbl.1). Figures for UC Riverside are similarly calculated.
[84]. See id. (calculating figure as follows: tbl.4 x line 5(6) tbl.1).
[85]. See supra note 76, for how students were divided between science and other majors within quartiles. Then the number of intended science majors was subtracted from the total number of students in the quartile using data in Arcidiacono et al. (2013) Tables 1 and 3 to give an estimated number of other majors. See id. at 7 tbl. 1, 12 tbl.3. This number was then multiplied by the percent of students in the quartile with other intended majors who received degrees as indicated in Arcidiacono et al. (2013) Table 4. See id. at 14 tbl.4. This procedure most likely overestimates the number of science majors and so will underestimate the number of other majors receiving degrees.
[86]. Recall quartiles are not school specific but are the applicant quartiles in which each student’s admissions credentials (or, in Arcidiacono et al. (2013), SAT scores) fell.
[87]. This figure is the total number of first and second quartile minority students who graduated from UC Berkeley with any degree minus the forty-seven students who would have received a science rather than a nonscience degree. The same approach is used to calculate the implications of channeling only intended science majors to UC Riverside.
[88]. I am thinking here not of the scholars who have done the research—the topic merits social science investigation—but for those who use it in the way general mismatch theory has been used: as a way to suggest that affirmative action hurts rather than helps minorities.
[89]. Compare Arcidiacono et al. (AER), supra note 56, at 28 tbl.6, with Arcidiacono et al. (2013), supra note 56, 35 tbl.11 (showing that the estimated gains in persistence for first and second quartile science-interested minorities who begin at UC Berkeley and transfer to Santa Cruz are about 1.5 percentage points higher in the AER article than they are in the earlier draft, but if the transfer is to Riverside, gains in the estimated probability of graduating with a science major are higher in Arcidiacono et al. (2013)). Estimated gains for intended science majors at UCLA who are hypothetically transferred to Santa Cruz are lower than the estimates for Berkeley but there is a greater difference between the two studies. The difference between the two estimates is 3.3 percentage points for first quartile students and 2.7 percent for those in the second quartile. Compare Arcidiacono et al. (AER), supra note 56, at 28 tbl.6, with Arcidiacono et al. (2013), supra note 56, 35 tbl.11. If instead, UCLA’s science-interested minorities are hypothetically placed at UC Riverside, the gain in the probability of science major graduation is only .9 percent for first quartile students, while for second quartile students the science major graduation probability is lower by .8 percent. Id.
[90]. I calculated these numbers by taking the total number of minority science majors in the UC system schools from Arcidiacono et al. (2013) Table 1; multiplying these numbers for each school by the table’s figures for the proportion of minorities at each school who were intended science majors; adding these numbers to get the total number of intended science majors beginning each year at the eight UC system schools; and multiplying the total number of minorities by the proportions of minorities at each school under the current allocation system and under a hypothesized race-neutral system. See Arcidiacono et al. (2013), supra note 56, at 7 tbl.1. Note that the latter proportions are taken from Arcidiacono et al. (AER). See Arcidiacono et al. (AER), supra note 56, at 33 tbl.8. I also calculated, using just Arcidiacono 2013’s Table 1 data, the proportions of minority intended science majors who would be at each school. See Arcidiacono et al. (2013), supra note 56, at 7 tbl.1. My results, although close to Arcidiacono et al.’s results, are not the same and suggest that the drops in intended science majors enrolling at UC Berkeley and UCLA would be somewhat greater than the results I report using the percentages taken from AER Table 8. See Arcidiacono et al. (AER), supra note 56, at 33 tbl.8. They also suggest that the sample of minority students used in the two articles may be slightly different even though the data source is the same, which could be the result of differentially missing data on the measures used to assign students to quartiles. Nothing important is likely to turn on the sample differences.
[91]. I calculated these figures by taking from Table 1, Arcidiacono et al. (2013) the total number of minority students enrolled at each of the UC system’s universities, multiplying these numbers by school specific graduation rates, and multiplying the resulting numbers by the school specific proportion of graduates whose major is science, and then calculating the total number of graduates in the sciences across all system schools and multiplying the resulting total by 1.98 percent. Supra note 56, at 7 tbl.1. The total number of science graduates includes a small number of students who entered these schools not intending to major in science but who switched to science majors and graduated with science degrees. This will further bias upwards the number of additional minority science graduates by increasing the base against which the percentage increase was multiplied, but the bias should be small.