Abstract
Regardless of what the Supreme Court decides on the fate of affirmative action, this Essay highlights a need to address the unappreciated extent of advantage that the intercollegiate athletics system provides to affluent white students. Drawing on public data sets, we test for the presence of affluent white advantage via race-neutral preferences conferred through athletics at elite schools that also practice race-conscious admissions, by comparing to schools that are legally prohibited under state law from doing so. The latter set, from the University of California system, is a natural experiment in facially race-neutral admissions. We show that at elite institutions like Harvard and University of North Carolina, well-resourced white students receive considerable cumulative benefits from athletics which do not extend to Asian American applicants. Compared to this athletic advantage, affirmative action gives only a “modest plus” to African American and Latinx applicants. And because of athletics and other admission by exception strategies, race neutral admissions do not ensure representation of minoritized groups at institutions. We join the substantial scholarly consensus showing that these facially race-neutral policies in fact are not race neutral. They create advantages for white applicants. Overlooking the role of athletics, we argue, contributes to a distorted view of affirmative action, merit, and therefore race-conscious admissions.
Introduction: Situating Harvard and UNC's Admissions Relative to Peer Universities
In the fall of 2022, an ultraconservative Court[1] heard two legal challenges to affirmative action at highly selective institutions[2]--Harvard University and the University of North Carolina (UNC).[3] The core question in both cases is whether the Court will eradicate over forty years of settled law establishing the constitutionality of affirmative action in higher education. In these most recent cases involving Harvard and UNC, challenger Students for Fair Admissions (SFFA) has argued the Court should overturn Grutter v. Bollinger,[4] which in 2003 affirmed the use of race to promote educational benefits of diversity (established in 1978 by University of California v. Bakke[5]) but only as one factor in a holistic admissions process. Now SFFA has claimed that this very narrowly tailored consideration of race violates the Equal Protection Clause for white and Asian American applicants and should be replaced by “race-neutral” admissions.[6] Most expect the Supreme Court will concur, ending or severely limiting affirmative action in June of 2023.
SFFA is a group organized and financially backed by Edward Blum, the conservative advocate who played an instrumental role in the Fisher[7] cases against the University of Texas (UT) Austin and in the landmark case that challenged the Voting Rights Act, Shelby County v. Holder.[8] After Fisher, Blum announced his next strategic move against affirmative action: “I needed Asian plaintiffs, and finding Asian plaintiffs to challenge the Ivy League admissions policies, Harvard in particular, is not an easy thing to do.”[9] These litigation tactics reflect the strategy of conservative opponents of affirmative action: opportunistically positioning certain wedge groups—white[10] women in Grutter, Gratz v. Bollinger[11] and Fisher, and Asian Americans in the recent Harvard case—in an effort to sew division and weaken the constitutional consideration of race in admissions for Black, American Indian, and Latinx students.[12]
These politically motivated lawsuits exploit Asian American students, framing them as members of a model minority in order to obscure the ways that admissions continue to disadvantage Black applicants, Indigenous applicants, and other applicants of color. More broadly, as the Supreme Court famously declared in Grutter, when it comes to elite institutions “it is necessary that the path to leadership be visibly open to talented and qualified individuals of every race and ethnicity.”[13] The claims of an equal protection violation, made by SFFA’s cases and other opponents of affirmative action, require careful scrutiny into all the ways that college admissions are in actuality not “visibly open” to all. In particular, as the Court and policymakers take up these questions in the months ahead, it is crucial to understand the advantages accrued through supposedly race-neutral admissions policies that confer value on recruited athletes, legacy applicants, dean’s preferences, and children of faculty and staff (ALDC).
In this Essay, we focus specifically on college athletics,[14] rendering visible this sometimes-invisible path to highly competitive admissions, and therefore to the powerful leadership positions after graduation that continue to favor those with elite education.[15] In a highly-stratified system of higher education, admission to highly selective institutions is extremely valuable, due to substantial proven economic and career advantages conferred upon graduation, as well as disproportionate gains in social and cultural capital. For example, almost half of all Fortune 500 CEOs hold degrees from one of twelve highly selective postsecondary institutions.[16] Moreover, the wage premium and economic returns of an elite college degree have risen markedly over the past few decades,[17] creating increased competition for spots at highly selective institutions.[18]
In particular, we unpack the underappreciated extent to which intercollegiate athletics at many premiere American private and public universities operate to reinforce enhanced opportunities for affluent white students. We do this by examining athletics admissions statistics at comparable peer institutions for Harvard and UNC, respectively. Where possible, we use data from natural experiment conditions like the University of California, Los Angeles (UCLA) that are under a statewide ban prohibiting the practice of race-conscious admissions. By comparing the UCLA data to UNC as academically similar public flagship universities, we can see the racially discriminatory impact that athletic admissions have on student populations when race-conscious admissions are prohibited. We add further evidence in support of the scholarly consensus that where race-conscious policies are outlawed, facially race-neutral19 policies continue to advantage white wealthy applicants, through standardized test scores, AP access, extracurriculars, and ALDC admits.20 These findings are relevant to advancing racial equity in higher education, regardless of what the Supreme Court decides about race-conscious affirmative action.
In 2018, the term ALDC was first introduced in an expert witness rebuttal report associated with the Students for Fair Admissions, Inc. v. President and Fellows of Harvard College (SFFA v. Harvard) lawsuit.[21] This case provided deep insight into how Harvard makes admissions decisions, including the use of ALDC preferences. While ALDC is normalized within facially race-neutral practices, it is widely accepted that ALDC considerations do not advance diversity goals; in fact, they primarily benefit white applicants.[22] For example, SFFA’s expert witness, Duke economist Peter Arcidiacono, and his colleagues found that 43 percent of white students admitted to Harvard received an ALDC preference between 2014 and 2019.[23] The authors noted that “roughly three-quarters of white ALDC admits would have been rejected absent their ALDC status.”[24] By contrast, less than 16 percent of admitted Black, Asian American, and Latinx students were ALDCs.[25] Harvard’s admissions preferences, in effect, constitute a form of affirmative action for white applicants.
Unlike ALDC, Admission by Exception (AxE) is the process by which a campus may admit applicants who do not meet the University of California (UC) eligibility requirements, but nonetheless who “demonstrate strong likelihood of success at UC or exceptional potential to contribute to the University or the State of California.”[26] At UC, the Regents policy on Undergraduate AxE allows campuses some flexibility to admit up to 6 percent of enrolled applicants under AxE.[27] The primary purpose is to support students from disadvantaged circumstances, such as low-income and first-generation college students or students from underperforming schools.[28] Notably this category can also be used to target international students “disadvantaged” by a technical shortage of UC A-G subject requirements; the result is large revenue gains for the institution to the detriment of local under-represented and actually disadvantaged students.[29] AxE is also used to support “other students,” including students with special talents or special circumstances such as athletes, veterans, adults, refugees, and students with dis/abilities.[30]
Regardless of actual usage, AxE is framed as a mechanism to expand access pathways for disadvantaged students with high potential for academic success. AxE, like ALDC at Harvard and other elite institutions, is a facially race-neutral admissions practice with the potential to support institutions in increasing access to underrepresented students of color. But this Essay suggests this is not the case. Our focus on athletics shines a light on these obscured paths to admission, which in reality are used by elite schools to admit wealthy white students in ways that appear “race neutral” but often are not.
I. Harvard, Asian Americans, and Athletics: Petitioner's Covert Reaffirmation of White Privilege and Performative Attack on Race
Figure 1 displays data for institutions in the elite Association of American Universities (AAU), the prestigious and powerful lobbying and accreditation body comprised of sixty-three top research universities, public and private, in the United States and Canada. This chart confirms that Harvard and other Ivy League universities will likely give athletic talents more consideration in the admission process than other similarly selective private universities. Likewise, even though elite public schools tend to have much larger student bodies and college athletes are a smaller percentage of the total, UNC is notably at the high end of the distribution compared to other elite U.S. public universities, including the University of Michigan, UCLA, UC Berkeley, and UT Austin.
Figure 1:[31] College athletes as a percentage of all undergraduates at elite public (at bottom) and private (at top) U.S. AAU schools in NCAA Division I
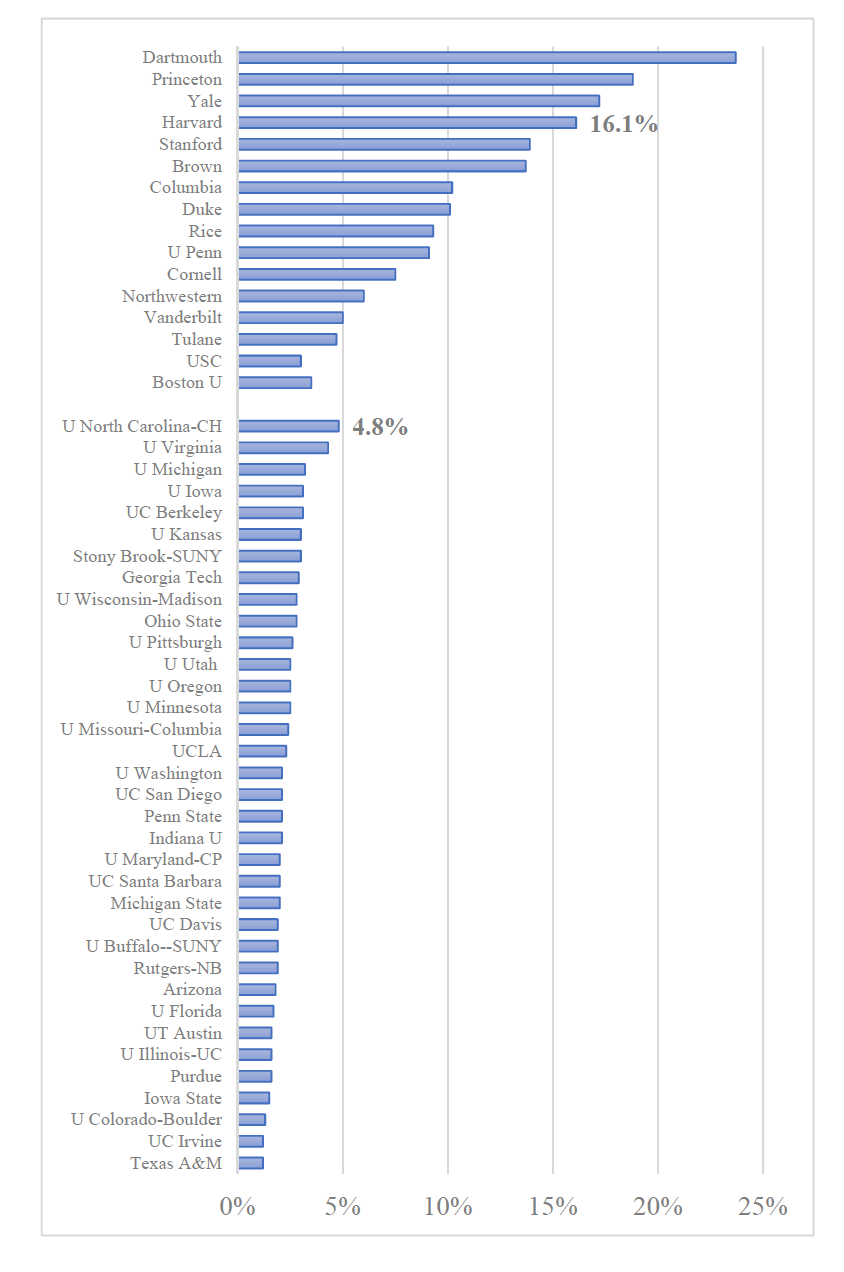
As shown in Figure 1, approximately 16 percent of undergraduates at Harvard compete on one or more NCAA Division I athletic teams. This is a higher percentage than any highly selective public university and higher than all elite private schools but for a few other Ivy League institutions. The district court judge in SFFA v. Harvard noted that ALDC applicants are “advantaged in Harvard’s admissions process” and are “disproportionately white, with 8% of white applicants being ALDCs compared to 2.7% of African American, 2.2% of [Latinx], and 2% of Asian American applicants,” and ALDCs “make up about 30% of each admitted class.”[32]
In SFFA v. Harvard, SFFA argued that "Harvard penalizes Asian-American applicants who are not legacies or recruited athletes"[33] and accordingly Arcidiacono, SFFA's expert witness, excluded ALDCs from his empirical models of Harvard admissions.[34] Harvard's expert witness, UC Berkeley economist and recent Nobel Laureate, David Card, was justifiably critical of SFFA and Arcidiacono's decision to omit ALDCs and other information from their baseline data sample before embarking on empirical modeling of Harvard admissions for the entering freshmen classes from 2014 to 2019.[35] The SFFA and Arcidiacono approach to compiling the evidence used in SFFA v. Harvard is a classic example of "omitted variable bias."[36] Since SFFA argued that Harvard's race-conscious admissions policy discriminated against Asian Americans, the omission of a variable that greatly favors white people over all other races functions to improperly attribute the effect that the ALDC policy has on the admissions of Asian Americans to other factors. The district court agreed: "Professor Arcidiacono's model explains only a portion of the variation in personal ratings[37] and likely suffers from considerable omitted variable bias" and "Professor Card's inclusion of ALDCs in the admissions model is preferred by the Court."[38]
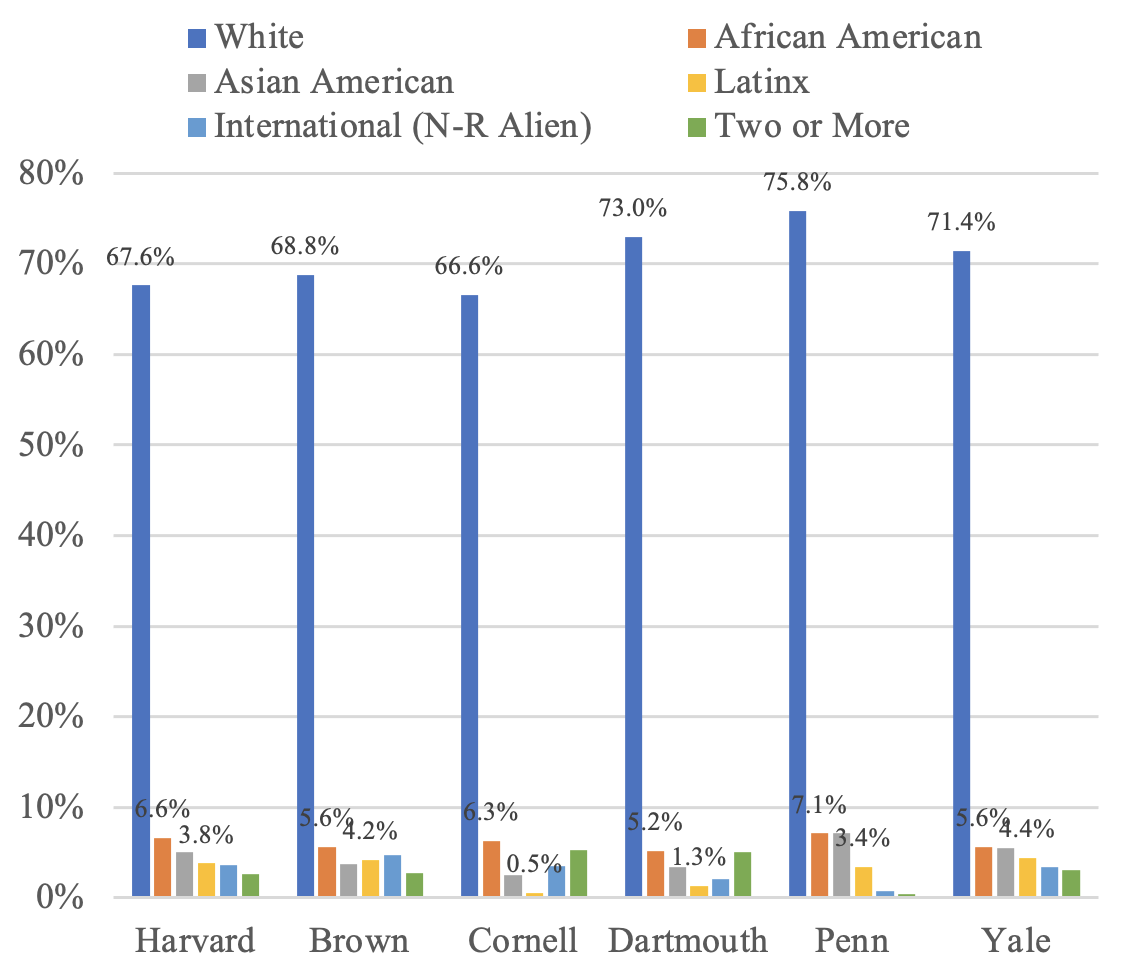
We sought to examine how Harvard advantages white college athletes in athletics admissions. In Figure 2, we supplement the SFFA v. Harvard district court’s focus on 2014–2019 data with data from official figures that Harvard and five other Ivies reported to the NCAA on the composition of its freshmen domestic and international athletes for 2006–2014.[39] The data in Figure 2 slightly understate the proportion of white college athletes because the additional “unknown/not report” category is most likely made up primarily of white students.[40] Across these six Ivy League schools, white students make up 71 percent of athletes. Only 6 percent of athletes are Black, 5 percent are Asian American, 3 percent are Latinx, and close to zero are American Indian and Pacific Islander athletes. The relative advantage of being an athlete as a white applicant is astounding compared to the relative disadvantage for Asian Americans and other ethnic groups.
If we take Harvard as an example and use the latest proportion of overall racial group admits as reported on the current admissions website, we can calculate the percentage change in admissions probability if one is an athlete compared to the overall racial group (which includes both athletes and nonathletes). According to our calculations based on the Harvard data presented in Figure 2, the result is an increase of 53.3 percent for whites (nonethnically labeled), but a decrease of 58.5 percent for Black students, a decrease of 69.6 percent for Latinx students, and a decrease of 80.3 percent for Asian American students.
Figure 2:[41] Composition of Freshmen Athletes at Harvard and Five Other Ivy League Schools, 2006–14 (NCAA)
The descriptive statistics in Figure 2 are consistent with the findings of a recent study by Jayakumar and Page examining the socioeconomic status and the embedded cultural systems that use athletics to produce this advantage for wealthy white applicants.[42] Elite private high schools feature "country club"[43] sports teams, like fencing and lacrosse, which are more expensive and rarer.[44] Participating in such sports primes graduates to be recognized as having "exceptional" athletic talent when applying to leading American private universities including Harvard, Princeton, and Stanford.[45] Jayakumar and Page show that, especially in the elite education athletics space, "racial privilege and cultural capital are intertwined in admissions policy and... cultural capital is often deployed in raced ways through institutional policies and procedures to further privilege white students."[46] In the public imagination (perhaps because college football and basketball are far more prominent in coverage across all media, including visual media such as television, making race salient), college athletics is commonly thought of as more racially diverse than other parts of the student body. In the real world, however, as Figure 2 shows, the overall composition of rosters that include country club sports like crew, fencing, water polo, and lacrosse tilts the playing field overwhelmingly toward white students at elite universities.
A telling example embedded in our data comes from Dartmouth, whose original colonial era charter, unique among what are now Ivy League institutions, decreed that part of Dartmouth’s mission was “for the education and instruction of Youth of the Indian Tribes in this Land.”[47] There were only roughly six American Indian freshmen athletes at Dartmouth in the dozen years covered in Figure 2.[48] Athletics could be a means of admitting Indigenous students. In fact, one of Dartmouth’s country club sports, lacrosse, originated with Iroquois and other Indigenous peoples in what is presently the U.S. and Canada several centuries before European colonial settlement.[49] Nearly a dozen federally recognized tribes in the United States are part of the Iroquois Confederacy, which sponsors the Iroquois Nationals men’s lacrosse team, who took the silver medal in the 2019 world indoor championship, while Team USA took bronze.[50] Even though the Iroquois Nationals are drawing from a pool of a few hundred players and Team USA from over one hundred thousand players, the Iroquois team still bested Team USA. The exceptional athletic talents of men and women lacrosse players, like those on the Iroquois Nationals team, however, are simply not visible in the elite private admissions ecosystems at Ivy League schools, where lacrosse players are twice as likely to come from elite private or parochial (typically affluent white) high schools as are the other students on those campuses.[51]
These data also underscore the way athletics has an underappreciated exclusionary effect for Asian Americans at elite institutions, as Figure 3 shows. If you take out ALDC admits altogether, who are mostly white, Asian American admission rates at Harvard would be comparable or higher than their white counterparts. In other words, without ALDC, the number of Asian American students at Harvard would likely outnumber white students.
Figure 3: Admission Rates for Non-ALDC Applicants at Harvard, 2014-19
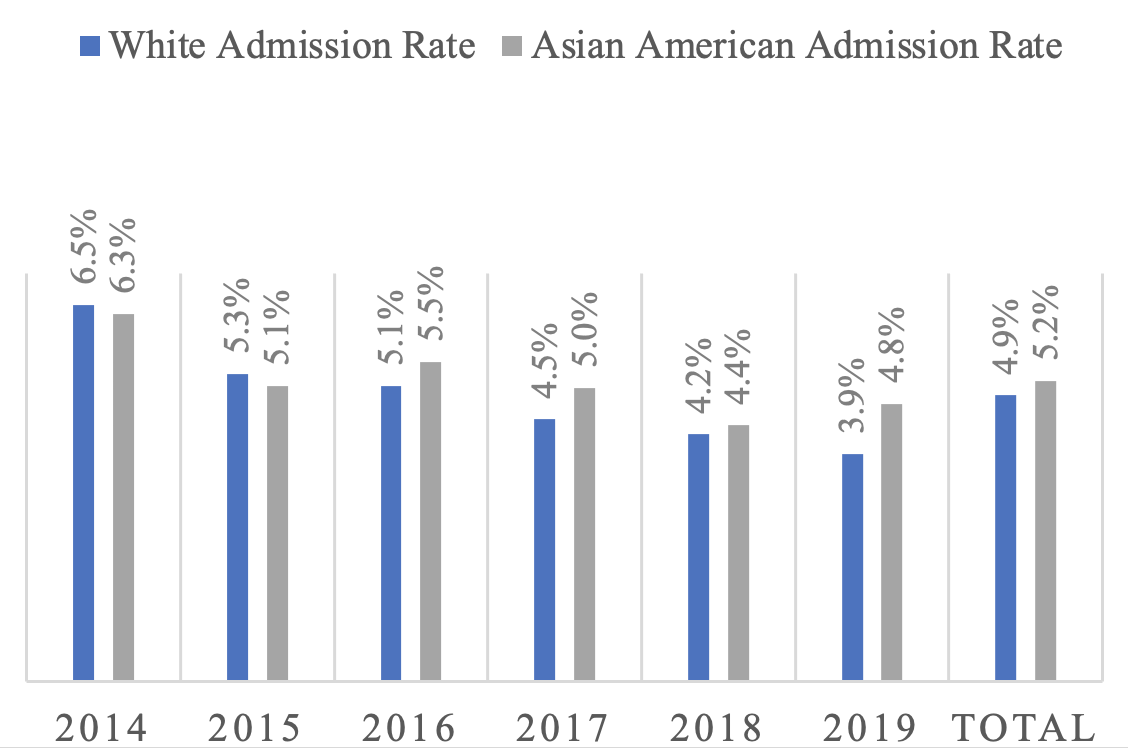
College athletes can be contrasted with the subset of non-ALDC applicants for the five years under review in SFFA v. Harvard. In Harvard’s case, Asian American applicants were admitted at a higher rate (5.15 percent) than white applicants (4.91 percent),[52] which left the SFFA plaintiffs in the position of arguing that Asian American applicants in the non-ALDC grouping should have had even higher admission rates.[53] As we discussed previously, Harvard themselves admitted this. The university released documents revealing that the rate of acceptance for athlete recruits was nearly one thousand times the rate for nonathletes with similar test scores.[54] This is an example of how facially race-neutral practices, like ALDC admissions, can create advantages for white students. These, rather than affirmative action, are the true source of disadvantage for Asian American applicants.
College athletes can be contrasted with the subset of non-ALDC applicants for the five years under review in SFFA v. Harvard. In Harvard’s case, Asian American applicants were admitted at a higher rate (5.15 percent) than white applicants (4.91 percent), which left the SFFA plaintiffs in the position of arguing that Asian American applicants in the non-ALDC grouping should have had even higher admission rates. As we discussed previously, Harvard themselves admitted this. The university released documents revealing that the rate of acceptance for athlete recruits was nearly one thousand times the rate for nonathletes with similar test scores. This is an example of how facially race-neutral practices, like ALDC admissions, can create advantages for white students. These, rather than affirmative action, are the true source of disadvantage for Asian American applicants.
II. The University of North Carolina Case and Race-Neutral Alternatives: California's Post-Affirmative Action Admissions, Athletics and the Continued Challenge of Racial Climate
In Students for Fair Admissions, Inc. v. Univ. of North Carolina (SFFA v. UNC), SFFA is challenging UNC on whether it sufficiently considered race-neutral alternatives to its current race-conscious admissions practices. So it is helpful to look to similar highly selective public institutions in states relying on facially race-neutral policies.[55] This is what is often referred to as a "natural experiment" condition.[56] Extensive scholarly research in natural experiment conditions reveals that where race-neutral alternatives are the only option, the percentage of Black, Latinx, and Native American (grouped under the umbrella category of "under-represented minority" (URM) in a number of research studies cited herein) matriculants has not fully recovered under restrictions of the ban.[57] A SFFA v. UNC amicus brief signed by 1246 scholars informs the Supreme Court that race-neutral policy environments have substantially reduced the number of students of color, especially Black students.[58] Even in California, where institutions have had nearly two decades to adjust to a statewide ban, the evidence is clear that flagship institutions, specifically UC Berkeley and UCLA, have not recovered percentages of URMs despite growth in URM representation at the State level.[59]
For UT, under the Top Ten Percent plan—a facially race-neutral policy that mandates college admission for the top ten percent of all Texas high school graduates—URM enrollment growth at flagship universities did not keep pace with demographic change in the state. Furthermore, URM students eligible under the Top Ten Percent plan were still more likely than white students to enroll at nonselective colleges.sup>[60] Flagships like UT Austin lost students with experience in integrated high schools as well as socioeconomic diversity—elements of what the school called “diversity within diversity.”sup>[61] These natural experiments in California and Texas have made it clear that race-neutral alternatives are inadequate as substitutes for race-conscious practices when it comes to ensuring representation at highly selective institutions.
By examining natural experiment conditions at the UC campuses, we can see how athletics contribute to this effect. The UC example is particularly instructive because relative to other elite U.S. universities, it invests heavily in institutional- and state-funded need-based financial aid and provides class-based affirmative action, which is one of the "race-neutral alternatives" of interest to the Supreme Court in SFFA v. UNC.[62] In addition to constituting a natural experiment, an examination of the UC points to "the upper limits of what elite public universities and state lawmakers are willing to sustain financially."[63] Even given that fact, intercollegiate athletics is a significant part of the overall opportunity structure at UC, which devotes high dollar amounts to athletic scholarship aid, much of it paid for with fees approved via student referenda that lock in long-term budgetary commitments.[64] In 2020–2021, UC campuses awarded $54.8 million in athletic scholarship aid, for an average award of $20,749 to each of the 2764 athletes—compared to an average award of $12,530 for a Cal Grant, $8273 for UC need-based financial aid grant, $5226 for a Federal Pell Grant, or $3326 for the State of California middle-class scholarship recipient.[65]
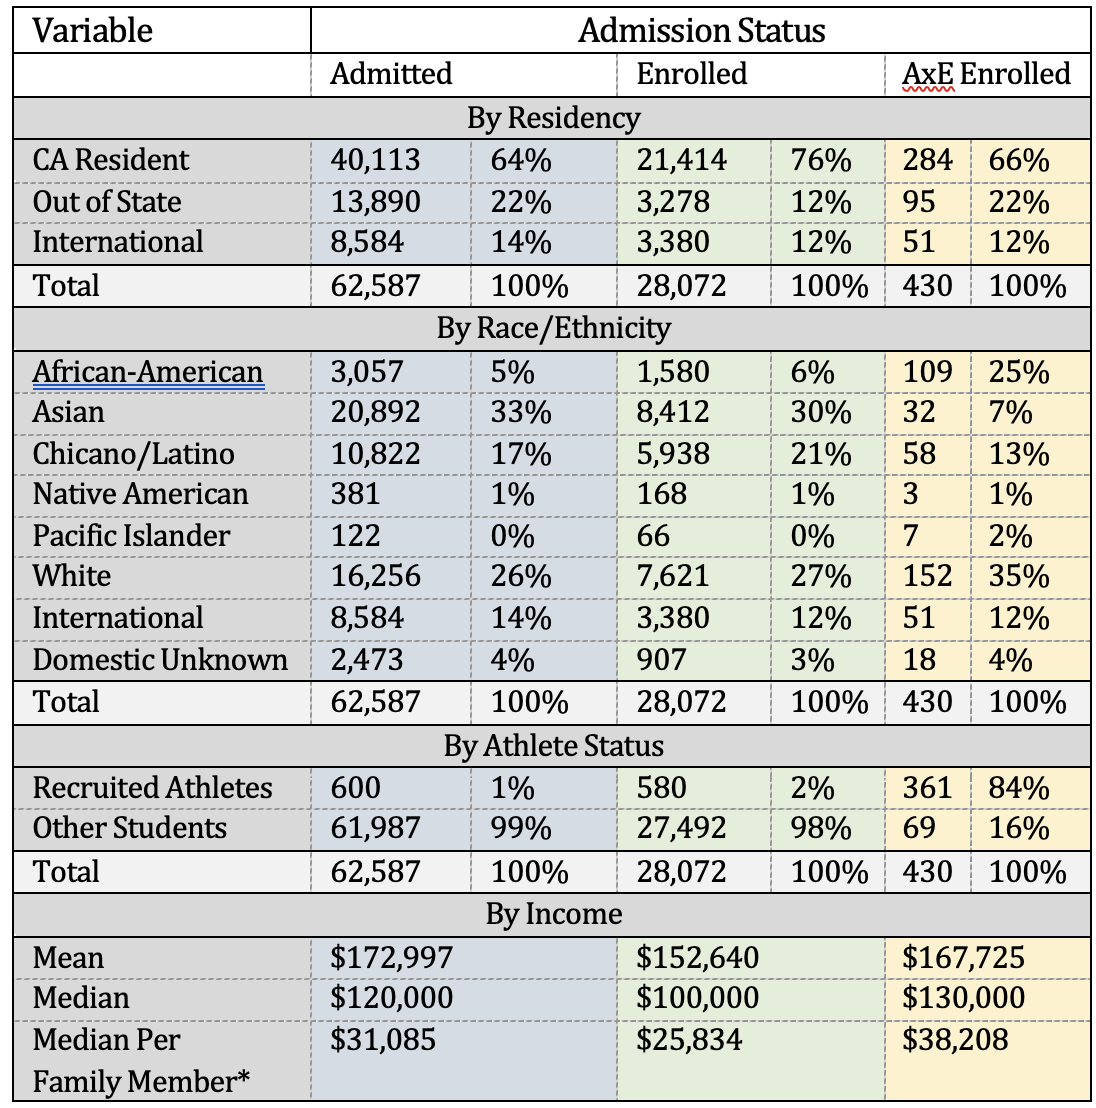
Recent post-affirmative action data for UC campuses suggest that a high share of AxE students are higher income.[66] While these data do not allow for an intersectional analysis by race and income, we do see a notable jump in the difference between the mean and median income of regularly enrolled versus AxE enrolled students. AxE contains more enrollees that come from the super-wealthy than the non-AxE enrollees. The racial dynamics are hard to capture from the summary statistics because AxE is not disaggregated by subcategories for the wealth data, so one cannot definitively say what group is primarily driving the wealth differences. Additionally, we can only speculate based on prior research, that the wealth difference would be even higher if we could isolate the 20 percent of AxE enrolled students that are college athletes.[67]
When institutions silo public data about wealth and racial demographics, it contributes to hiding AxE (and ALDC) admissions' facially race-neutral advantages to wealthy white applicants; this is the case with UC. But if UC students reflect the national demographic data, then Black students come from households whose mean income is nearly $70,000 lower than white households (and whose median household income is nearly $26,000 lower).[68] For Latinx households, the mean income is nearly $66,000 lower than whites (and the median household income is approximately $23,000 lower).[69] However, income disparities only tell a small part of the story. Data also reveal significant racial differences in both median and mean household wealth.[70] White households have the highest median ($188,200) and mean ($983,400) wealth, whereas Black households have the lowest median ($24,100) and mean ($142,500) wealth.[71] Latinx households have slightly more median and mean wealth than Black households but much lower than white households, with $36,100 and $165,500, respectively.[72] Black and Latinx households with children are, respectively, 2.3 and 2.1 times more likely than whites to experience "food insecurity," defined as insufficient food to eat for an active healthy life.[73] And homes in Black neighborhoods are worth 23 percent less than homes of similar quality in white neighborhoods.[74] Moreover, these racial disparities in wealth do not shrink appreciably when accounting for education level, income, and homeownership.[75]
When looking at the UC aggregated data from the 2020 audit report tables, we find that AxE is a complex mixture of URM athletes, white and international athletes, and a large group of students who marked their race as "other," who likely are not cumulatively disadvantaged relative to other freshmen and transfer enrollees. Table 3 (as labeled in the UC audit report)[76] indicates that 58 percent of AxE Black students were recruited athletes (174 of 301 total), whereas 33 percent of white (233 of 713 total), 18 percent of Latinx (89 of 483 total), 8 percent of Asian (41 of 486 total), and 9 percent of international (112 of 1314 total) AxE students were recruited athletes. Contrary to the commonsense understanding of and purported aim of AxE to create access for under-resourced students,[77] Table 1 shows that the mean income is much higher for AxE students than it is for their traditionally enrolled counterparts.[78] We can further speculate, based on national racial demographic data, that the lift in income for AxE admits is not coming from Black and Latinx students.[79]
Table 1
Characteristics of Admitted Applicants, Enrolled Students, and Enrolled Admitted by Exception Students – Fall 2017 through Winter 2020
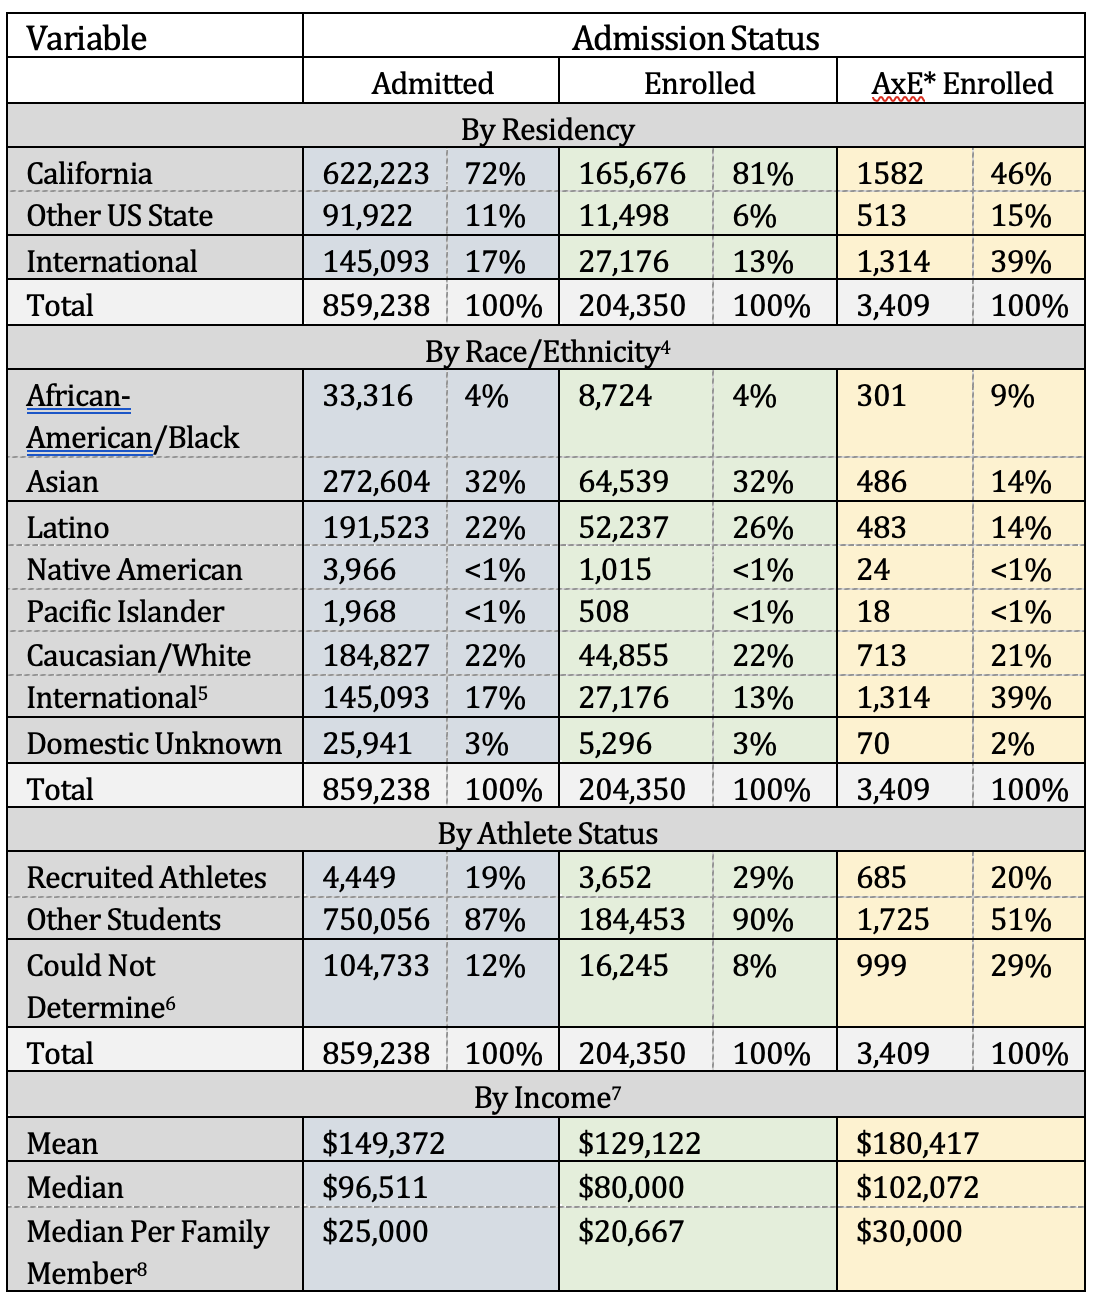
Table 2
Racial/Ethnic Identity and Athlete Status of Enrolled Admitted by Exception Students – Fall 2017 through Winter 2020
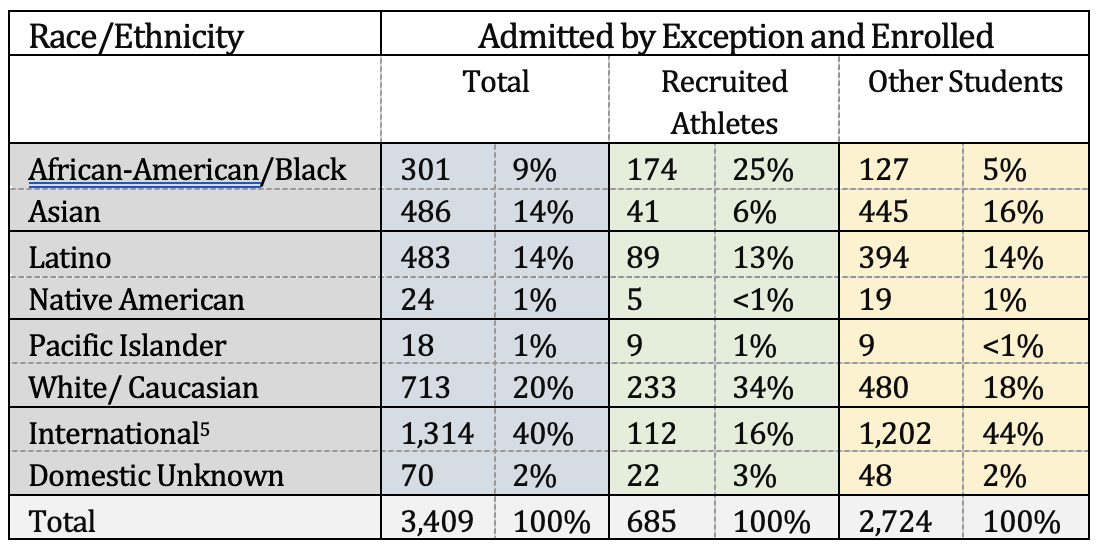
Table 3
UCLA Freshmen and Transfers from Fall 2017, Fall 2018, Fall 2019: Characteristics of Admits, Enrolled and Enrolled Admitted by Exception Students
Note. We did not have family size information, so we used the same implied ratio as the systemwide info.
Table 4
UCLA Freshmen and Transfers from Fall 2017, Fall 2018, Fall 2019: Racial/Ethnic Identity and Athlete Status of Enrolled Admitted by Exception Students
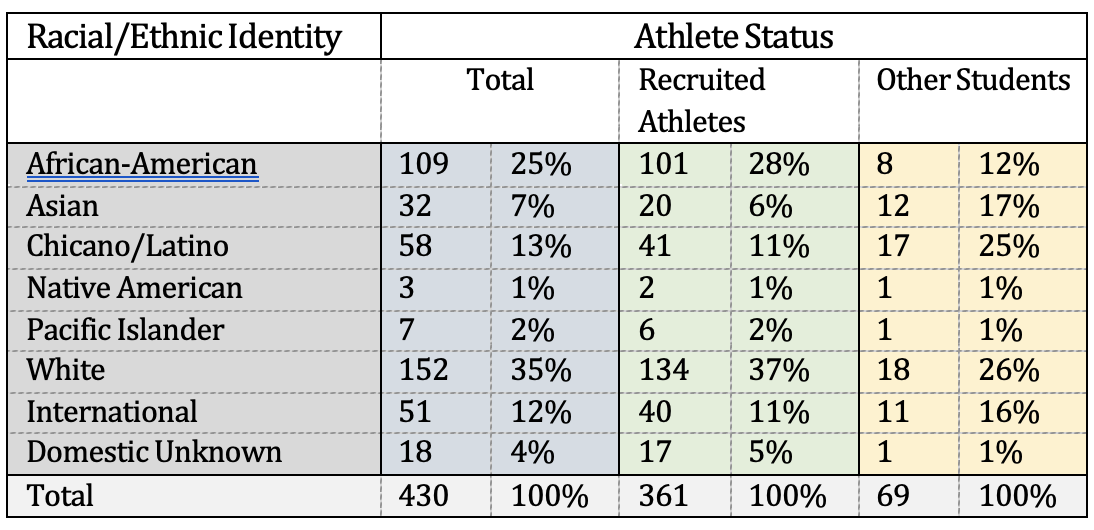
The AxE story becomes squarely about racial and socio-economic privilege when zeroing in on UCLA, a campus most comparable to UNC in selectivity, as shown below in Tables 3 and 4.
The data we obtained[80] shows that white students make up 37 percent of AxE admissions at UCLA among recruited athletes, and 26 percent of nonathletes. But this number likely understates the percentage of white students who benefit from AxE, when we take international students into account. The majority of international college athletes compete at Division I and II schools. During the 2018–2019 academic year, NCAA Division I comprised 98,948 domestic athletes and 13,935 players from a country of origin outside of the United States.[81] Table 5 highlights the top ten home countries of Division I international athletes.[82]
Table 5
Top Ten Home Countries by Percentage of First-Year Division I International Athletes
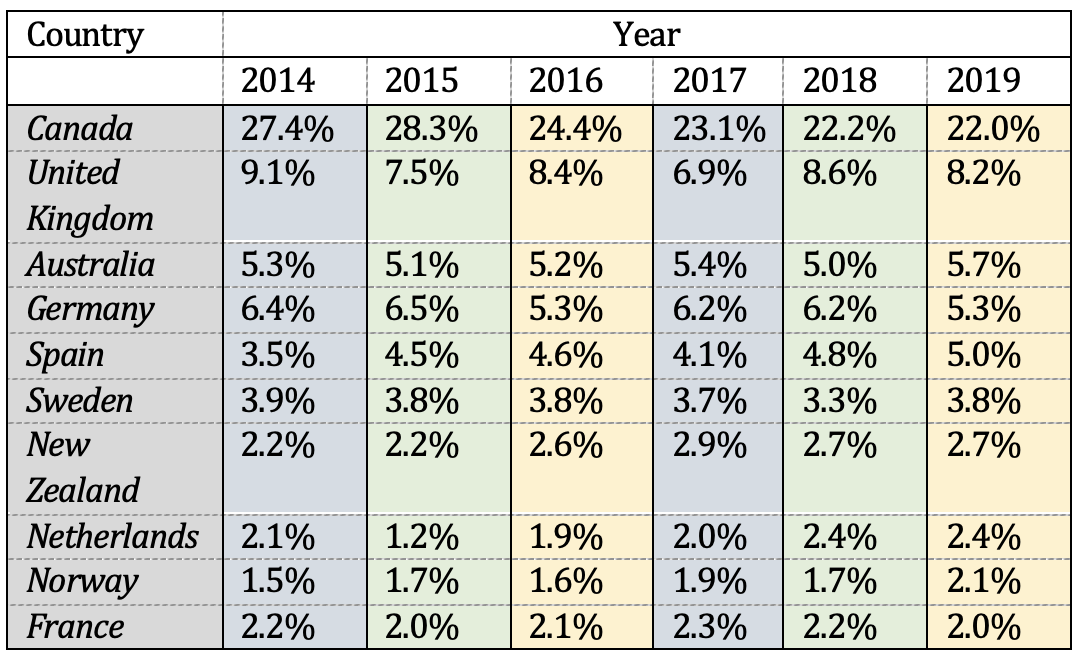
Men’s and women’s sports with the highest percentage of international athletes are tennis, golf, soccer, swimming, cross country, water polo, field hockey, volleyball, beach volleyball, and gymnastics.[83] As already discussed, these country club sports[84] are overwhelmingly white.[85]
Therefore, if we combine UCLA's international students with white students, given that the overwhelming majority of international college athletes are white,[86] that brings us to a total of 48 percent of athlete AxE admissions who are white, including international athletes.[87] This is compared to Black admits, who constitute 28 percent of AxE admissions among recruited athletes, and only 12 percent of nonathletes in the AxE category. For AxE admits, Asian-Americans make up just 6 percent of recruited athletes and 17 percent of nonathletes. Pacific Islanders represent just 2 percent of recruited athletes and 1 percent of nonathletes. These data suggest that, just as with Harvard's ALDC outcomes, even in "natural experiment conditions" where race-conscious admissions are banned, Asian Americans are not benefiting from AxE as much as other groups, and whites are benefiting disproportionately for AxE for both recruited athletes and nonathlete students.[88] Since the AxE category, under longstanding faculty-set policy, is intended to primarily be composed of educationally disadvantaged students while including others with special talents like athletics, this discrepancy is remarkable and important.[89]
While we do not have information on socioeconomic status disaggregated by race, the UCLA data reveal the mean income for total enrolled students at UCLA is $152,640. For AxE enrolled students, it is higher at $167,725, which suggests that the pool of AxE admits are wealthier than students who are not admitted by AxE. Both the UC-wide and UCLA figures likely understate the magnitude of socioeconomic status disparities because the income data are provided voluntarily on the UC application[90] and affluent students are less incentivized than low-income students to provide these data. And based on prior research on college athletes, we know that many of these students participate in country club sports.[91]
Although the UCLA data does not disaggregate by race, Los Angeles specific data reveal remarkable disparity between Black and white households that serves as a meaningful example to illustrate the impact of pervasive income inequality along racial lines. In Los Angeles, Black students come from homes with median incomes that are nearly $42,000 lower than whites.[92] These data also show that white households in Los Angeles have a median net worth and median liquid worth of $355,000 and $110,000, respectively.[93] In contrast, Black households in Los Angeles have a median net worth and median liquid net worth of $4,000 and $200, respectively.[94] The difference between liquid net worth and net worth is that liquid net worth represents cash or assets that can be quickly converted into cash and includes money in savings, checking, stocks and bonds, and money market; whereas net worth is the value of assets minus liabilities. Liquidity is the most important measure of wealth for purposes of impact on the quality of daily life experiences, as the economic response to the COVID pandemic clearly underscored.[95] There is also literature that shows that most Black students in revenue-generating sports of football and men's basketball tend to be low income.[96] Relatedly, we know that Black athletes are less likely to compete in country club sports such as lacrosse, field hockey, rowing, and golf, in part because of the growing costs of membership fees and equipment to participate in these sports at the youth levels.[97]
Contrasting the UCLA data to that from a less selective UC institution is helpful in demonstrating how the AxE advantage is exacerbated at more prestigious institutions where admissions is more high stakes and where sports generate income for the university. The data we obtained[98] for UC Riverside (UCR) indicates that athletes make up only 15 percent of admission by exception and enrolled students (compared to 84 percent at UCLA). Of the AxE athletes enrolled at UCR, most of the domestic admits are white (26 percent), followed by 20 percent Black, 17 percent Latinx, and zero Asian, Pacific Islander, or Native American admits. International AxE athletes make up 32 percent of AxE athletes. In contrast to UCLA, NCAA Division I athletics at UCR is much more modest in scale and is not objectively revenue generating (UCLA’s athletics budget was $130 million last year compared to $14 million at UCR, which also does not have college football).[99] It is a starkly different picture at UCLA, where a larger number of white scholarship athletes benefit from AxE admissions practices. Contrary to the idea that AxE expands access to higher education, like ALDC at Harvard and other elite private institutions, it is these ostensibly race-neutral admissions practices that exclude Black, Latinx, and Asian American students in disproportionate numbers.
Conclusion
Many admissions practices and metrics—standardized tests, GPA, Advanced Placement course access and requirements, K-12 schooling inequalities, college application counseling and coaching disparities[100] — continue to advantage well-resourced white applicants, and as we have highlighted, athletics in particular and ALDC in general contribute greatly to admission inequality. In this Essay, we have focused on the athletic advantage, but more broadly, our data show that these advantages happen within race-neutral natural experiments, like the UC system, where AxE students UC-wide are wealthier than traditionally enrolled students. This is problematic as it shows that AxE is not elevating nonprivileged students but rather creating a backdoor entry for students who already have economic, social, or cultural capital. Data disaggregating income status by race were not publicly or readily made available. At UCLA—the only flagship UC that made their data available to us—we found a clear advantage for white students. Extrapolating from socioeconomic data, it is likely that AxE admissions system-wide favors white students. But the difficulty we had accessing the data to demonstrate this points to a deeper issue, that has great significance for both the Harvard and UNC cases and beyond: these racial advantages are often normalized and ignored, hidden not only beneath “race-neutral” policies, but through reporting that creates the appearance of diversity where white and wealthy students are still favored.
Harvard revealed during SFFA v. Harvard that they create an advantage for white students through athletics admissions, effectively creating relative disadvantage for students of color, including Asian Americans. While SFFA v. Harvard incentivized Harvard to be transparent about their favoritism toward whites, most institutions, especially those facing a race-neutral policy environment (with a statewide ban), are not. In fact, when they are incentivized instead to signal diversity, information about the ways their policies advantage white students can be hard to find. When institutions can avoid reporting the racial composition of their international athletes as is the case for UC, they can obscure the whiteness and socio-economic standing of that cohort. And when institutions can report international students of color as part of their compositional racial diversity, without reporting where those students originate and their socio-economic status, it can create the appearance of addressing the disadvantages created by structural racism in the United States without actually doing so.[101] These reporting loopholes incentivize institutions to be opaque about the ways their policies and procedures actually favor high socioeconomic status white students. This is one of many reasons why affirmative action has been an important and necessary intervention.
When Justice Powell delivered the limiting Bakke opinion of the Supreme Court in 1978, establishing the “diversity rationale” as the only legally permissible justification for utilizing race-conscious affirmative action, he included a potentially powerful legal idea.[102] In Bakke footnote forty-three, Powell states, “To the extent that race and ethnic background were considered only to the extent of curing established inaccuracies in predicting academic performance, it might be argued that there is no ‘preference’ at all.”[103] As law professor Devon Carbado has persuasively argued, footnote forty-three offers a way to reconceptualize race-conscious admission not as a “preference” but as a “countermeasure” that corrects for racial disadvantages or bias in conventional admissions policies.[104] Yet, since Bakke and Grutter, institutions must prove that their consideration of race is narrowly tailored, and that they have exhausted all viable race-neutral alternatives before resorting to race-sensitive practices. Following the logic of the Bakke footnote, would it not make more sense for institutions to be required to demonstrate that their supposedly race-neutral admissions practices do not create disadvantages for students of color?
No matter the outcome of the pending Supreme Court cases, this Essay suggests the need for ongoing interrogation of normative metrics, like athletic excellence, that carry out racism under cover of everyday (race-neutral) admissions practices, creating substantial advantages for white students, exacerbated in their aggregate. If the Supreme Court outlaws race-conscious admissions, we can expect that race-neutral alternatives and proxies will be next on the chopping block. When this happens, without racism-consciousness in admissions, the normative admissions metrics—such as the SAT, extracurriculars, and grades—that are assumptively race-neutral (although they are not) will be unchecked, and unfairly become the entire basis for determining who gets into selective institutions. Until institutions become more transparent, scholars and legal advocates should keep asking questions about how institutional data, reporting, and admissions decisionmaking hide the ways in which selection processes continue to do what they have always done: obscure longstanding favoritism toward white and wealthy applicants.
[1] Four seats have turned over since the Court last upheld the constitutionality of affirmative action, with only one filled by a liberal-leaning justice, Justice Ketanji Brown Jackson (who, as a former Harvard Board of Overseers member, will be recused in the Harvard case, but not the UNC case). See Adam Liptak, Justice Jackson, A Former Law Clerk, Returns to a Transformed Supreme Court, N.Y. Times (July 18, 2022), https://www.nytimes.com/2022/07/18/us/politics/ ketanji-brown-jackson-scotus.html [https://perma.cc/XKA7-P4YL].
[2] In 2022, Harvard accepted 3.13 percent of applicants. Rahem D. Hamid & Nia L. Orakwue, 83 Percent of Admitted Students to Join Harvard College Class of 2026, Harvard Crimson (July 7, 2022), https://www.thecrimson.com/article/2022/7/7/class-of-2026-yield-data [https://perma.cc/7K5Q-5RLT]. UNC accepted 16.8 percent. Admissions, U. N.C. CHAPEL HILL, https://admissionslawsuit.unc.edu/about/admissions [https://perma.cc/57XJ-5U9U].
[3] Students for Fair Admissions, Inc. v. President & Fellows of Harvard Coll., 980 F. 3d 157 (1st Cir. 2020), cert. granted, 142 S. Ct. 895 (Jan. 24, 2022); Students for Fair Admissions, Inc. v. Univ. of N.C., 567 F. Supp. 3d 580 (M.D.N.C. 2021), cert. granted, 142 S. Ct. 896 (Jan. 24, 2022). The Court deconsolidated the two cases for oral argument. See Transcript of Oral Argument, Students for Fair Admissions, Inc. v. President & Fellows of Harvard Coll., 142 S. Ct. 895 (2022) (No. 20-1199); Transcript of Oral Argument, Students for Fair Admissions, Inc. v. Univ. of N.C., 142 S. Ct. 896 (2022) (No. 21-707).
[4] 539 U.S. 306 (2003).
[5] 438 U.S. 265, 32224 (1978) (appendix to opinion of Powell, J.). The Bakke case is mentioned over sixty times in the several opinions in Grutter v. Bollinger, 539 U.S. 306 (2003). For the contemporary significance of Bakke, see Symposium, Bakke at 40: Diversity, Difference and Doctrine, 52 U.C. Davis L. Rev. 2239 (2019).
[6] Brief for Petitioner at 2–3, Students for Fair Admissions, Inc. v. President & Fellows of Harvard Coll. and Students for Fair Admissions, Inc. v. Univ. of N.C., 142 S. Ct. 895 (2022) (No. 20-1199).
[7] Fisher v. Univ. of Tex. at Austin, 570 U.S. 297 (2013) [hereinafter Fisher I]; Fisher v. Univ. of Tex. at Austin, 579 U.S. 365 (2016) [hereinafter Fisher II].
[8] 570 U.S. 529 (2013); see also Anemona Hartocollis, He Took on the Voting Rights Act and Won. Now He’s Taking on Harvard, N.Y. Times (Nov. 19, 2017), https://www.nytimes.com/ 2017/11/19/us/affirmative-action-lawsuits.html [https://perma.cc/MSP2-3J9B].
[9] OiYan Poon, Edward Blum: “I needed Asian plaintiffs,” Youtube, at 18:48 (July 30, 2018), https://www.youtube.com/watch?v=Dibvo-05JRg [https://perma.cc/FH5W-ED2L] (speech given by Edward Blum at the 2015 seminar hosted by the Houston Chinese Alliance); see also Liliana M. Garces & OiYan Poon, Asian Americans and Race-Conscious Admissions: Understanding the Conservative Opposition’s Strategy of Misinformation, Intimidation and Racial Division, C.R. Project, at 6 (Nov. 1, 2018), https://www.civilrightsproject.ucla.edu/ research/college-access/affirmative-action/asian-americans-and-race-conscious-admissions-understanding-the-conservative-opposition2019s-strategy-of-misinformation-intimidation-racial-Addeddivision/RaceCon_GarcesPoon_AsianAmericansRaceConsciousAdmi.pdf [https://perma.cc/8V8Q-CA54].
[10] We do not capitalize the terms “white” or “whiteness” because both have been constructed based on violence and exclusion of people of color and thus do not equate to other racial/ethnic groups as having a legitimate claim to a shared culture or identity outside of violence. See Cheryl I. Harris, Whiteness as Property, 106 Harv L. Rev. 1707, 1785-86 (1993). See generally David Roediger, Towards the Abolition of Whiteness (1994).
[11] 539 U.S. 244 (2003).
[12] Indeed, as Poon and Segoshi conclude in their study of Supreme Court amicus briefs: “Understanding how [Asian Americans] are engaged as subjects, and not just as objects, in policy discourses can advance an understanding of the complex nature of racial politics, ideological and discursive strategies in affirmative action debates, and avoid the silencing racial mascot phenomenon.” OiYan A. Poon & Megan S. Segoshi, The Racial Mascot Speaks: A Critical Race Discourse Analysis of Asian Americans and Fisher vs. University of Texas, 42 Rev. Higher Educ. 235, 263 (2018); see also William C. Kidder, Negative Action Versus Affirmative Action: Asian Pacific Americans Are Still Caught in the Crossfire, 11 Mich J. Race & L 605, 621 (2006) (discussing treatment of Asian Americans as a “buffer” group that “aids and abets affirmative action opponents and skews the public debate by improperly casting [Asian Americans] as the enemies of diversity”); Gabriel J. Chin, Sumi Cho, Jerry Kang & Frank Wu, Beyond Self-Interest: Asian Pacific Americans Toward a Community of Justice, a Policy Analysis of Affirmative Action, 4 Ucla Asian Pac. Am. L.J. 129, 161 (1996) (calling upon conservatives to “cease using [Asian Americans] as their ‘racial mascot’ to arrogate moral authority in furtherance of regressive policies”).
[13] Grutter v. Bollinger, 539 U.S. 306, 332 (2003). We use “Asian American” in this essay as a term inclusive of Pacific Islanders unless otherwise noted.
[14] This Essay does not use the term student-athlete unless it is a direct reference to the NCAA manual. College athletes must be registered students to be eligible to play. Therefore, the term student-athlete is redundant. College basketball student-athlete is an example of redundancy. Instead, this Essay uses “college athlete” or “athlete.” In addition, high ranking NCAA officials have openly admitted that the term student-athlete was invented to be emphatic about athletes being students. The NCAA was afraid that athletic scholarships might lead the courts to view college athletes as employees. See generally Walter Byes with Charles Hammer, Unsportsmanlike conduct: exploiting college athletes 69 (1995).
[15] See Rebecca Shamash, (Re)production of the Contemporary Elite Through Higher Education: A Review of Critical Scholarship, 8 Berkeley Rev. Educ. 5, 5-6 (2018).
[16] Menachem Wecker, Where the Fortune 500 CEOs Went to School, Yahoo News (May 14, 2012), https://news.yahoo.com/where-fortune-500-ceos-went-school-145818980.html [https://perma.cc/GDQ4-AL9H].
[17] See e.g., Sandra E. Black, Jeffrey T. Denning & Jesse Rothstein, Winners and Losers? The Effect of Gaining and Losing Access to Selective Colleges on Education and Labor Market Outcomes 1 (Nat’l Bureau of Econ. Rsch., Working Paper No. 26821, 2020) (discussing the positive earning outcomes of students who attend selective colleges); Jack Mountjoy & Brent R. Hickman, The Returns to College(s): Relative Value-Added and Match Effects in Higher Education 1 (Nat’l Bureau of Econ. Rsch., Working Paper No. 29276, 2021); Eric R. Eide, Michael J. Hilmer & Mark H. Showalter, Is It Where You Go or What You Study? The Relative Influence of College Selectivity and College Major on Earnings, 34 Contemp. Econ. Pol'y 37, 3738 (2016); Dirk Witteveen & Paul Attewell, The Earnings Payoff From Attending a Selective College, 66 SOC. SCI. RSCH. 154, 15455 (2017).
[18] Sean F. Reardon, Rachel Baker, & Daniel Klasik, Stanford Ctr. Educ. Pol'y Analysis, Race, Income, and Enrollment Patterns In Highly Selective Colleges, 1982–2004, at 2 (2012), https://cepa.stanford.edu/sites/default/files/race%20income%20&%20selective%20 college%20enrollment%20august%203%202012.pdf [https://perma.cc/E6KU8FXM].
[19] In this Essay, we use the term “facially race-neutral” admissions policies to speak about normative admissions metrics that are thought to be race-neutral but are not. For example, a facially race-neutral policy that is actually racially biased is one that prefers applicants with many extracurricular activities, which often are only offered at affluent, white schools. These are not limited to those policies promoted as “race-neutral” alternatives or proxies that the Court says should be exhausted before race-conscious practices are justifiable by law.
[20] See, e.g., Julie J. Park et al., Inequality Beyond Standardized Tests: Trends in Extracurricular Activity Reporting in College Applications Across Race and Class (Annenberg Institute at Brown University, EdWorkingPaper 23-749, 2023), https://edworkingpapers.com/ sites/default/files/ai23-749.pdf [https://perma.cc/EZ58-TUF3] (finding that “White, Asian American, high-SES, and private school students reported substantially more activities, more activities with top-level leadership roles, and more activities with distinctive accomplishments (e.g., honors, awards),” in a study of nearly six million U.S. college applications on the Common Application platform); Michael N. Bastedo, Nicholas A. Bowman, Kristen M. Glasener & Jandi L. Kelly, What Are We Talking About When We Talk About Holistic Review? Selective College Admissions and Its Effects on Low-SES Students, 89 J. Higher Educ. 782, 783 (2018) (discussing disadvantages that low-income students of color face with respect to extracurricular activities and college admissions compared to affluent white students); Uma M. Jayakumar, Liliana M. Garces & Julie J. Park, Reclaiming Diversity: Advancing the Next Generation of Diversity Research Toward Racial Equity, in 33 Higher Education: Handbook of Theory and Research 11, 57 (Michael B. Paulsen ed., 2018).
Discrepancies in the benefits linked with SAT prep suggest that solutions that focus on expanding its availability, as the College Board has done by partnering with online tutoring resource Khan Academy, are laudable but fall short of ensuring equity in college admissions . . . . Likewise, findings on the inequities of SAT prep—not just in terms of access, but in terms of its actual benefits—raise major concerns about reliance on SAT scores in admissions decisions, particularly at the level of selective and highly selective admissions.
Id. Jeff Owings, Timothy Madigan & Bruce Daniel, Nat'l Ctr. Educ. Stats., Pub. No. 98-095, Who oes to America's Highly Ranked "National" Universities? (1998); Kirsten Hextrum, Special Admission: How college Sports Recruitment Favors White, Suburban Athletes (2021); Rethinking College Admissions: Research-Based Practice and Policy (OiYan A. Poon & Michael N. Bastedo eds., 2022) (chapters 2, 3, 5 and 6 address multiple dimensions of these equity challenges).
[21] Rebuttal Report of David Card at 30, Students for Fair Admissions, Inc. v. President & Fellows of Harvard Coll., 397 F. Supp. 3d 126 (D. Mass. 2019) (No. 14-cv-14176) (noting that ALDC refers to “Athlete, Lineage, Dean/director list, Children of faculty/staff” applicants).
[22] See Uma Mazyck Jayakumar & Scott E. Page, Cultural Capital and Opportunities for Exceptionalism: Bias in University Admissions, 92 J. Higher Educ. 1109, 111112, 1129–31 (2021). See generally Natasha Warikoo, Is Affirmative Action Fair>: The Myth of Equity in College Admissions (2022); Anthony P. Carenvale, Peter Schmidt & Jeff Strohl, The Merit Myth: How Our College Favor the Rich and Divide America (2020).
[23] Peter Arcidiacono, Josh Kinsler & Tyler Ransom, Legacy and Athlete Preferences at Harvard, 40 J. Lab. Econ. 133, 133 (2022).
[24] Id.
[25] Id.
[26] Bd. Admissions & Rels. With Schs., Guidelines for Implementation of University Policy on Admission by Exception for California Residents 2 (2020) https://senate.universityofcalifornia.edu/_files/committees/boars/documents/a-by-e-guidelines.pdf [https://perma.cc/GC4Q-RX9C].
[27] Id. at 1.
[28] Id.
[29] Anonymous UC administrator, personal communication with the author regarding the use of AxE at a particular UC, April 3, 2023.
[30] Id.
[31]. Equity in Athletics Data Analysis, U.S. Dep't Educ., https://ope.ed.gov/athletics [https://perma.cc/6E3D-7FST]; Our Members, Assoc. Am. Univs., https://www.aau.edu/ who-we-are/our-members [https://perma.cc/X6WW-QVQ3] (noting sixty-three Association of American Universities in the U.S. “leading” “innovation, scholarship, and solutions”). Figure 1 excludes a few AAU member schools that are either Canadian, like the University of Toronto, or are U.S. universities without Division I athletics, such as Brandeis and University of California (UC) Santa Cruz.
[32]. Students for Fair Admissions, Inc. v. President & Fellows of Harvard Coll., 397 F. Supp. 3d 126, 138, 138 n.16, 159 (D. Mass. 2019).
[33]. Plaintiff’s Memorandum of Reasons in Support of Its Motion for Summary Judgment at 27, President & Fellows of Harvard Coll., 397 F. Supp. 3d 126 (No. 14-cv-14176).
[34]. This rationale is also explained in a companion essay by Arcidiacono and another SFFA consultant that purports to not represent the views of SFFA. Peter Arcidiacono, Josh Kinsler & Tyler Ransom, Affirmative Action, Transparency, and the SFFA v. Harvard Case, 2020 U. CHi. L. Rev. Online 119, 127 (“Note that 97 percent of Black and Hispanic applicants are typical (non-ALDC) applicants.”). This cited statistic does not justify the modeling choice the SFFA experts and consultants advocate, for it merely underscores how Black and Latinx students are not substantially benefiting (nor are Asian Americans) from the recruited athletes, legacies, and Dean’s list category the SFFA plaintiffs characterize as “not typical” but that represents the pathway for about “30% of Harvard’s admitted class.” President & Fellows of Harvard Coll., 397 F. Supp. 3d at 160.
[35]. Report of David Card at 7, President & Fellows of Harvard Coll., 397 F. Supp. 3d 126 (No. 14-cv-14176) (“Prof. Arcidiacono reveals a significant misunderstanding of Harvard’s admissions process by focusing so much of his analysis on academic achievement. For example, four of the six regression models that Prof. Arcidiacono offers do not include controls for the three non-academic ratings (extracurricular, personal, and athletic), which are central to Harvard’s evaluation of candidates for admission.”).
[36]. Report of David Card, supra note 35, at 59. As Card explains:
Omitted variable bias occurs whenever a regression model omits variables that (1) are correlated with the variable of interest and (2) affect the outcome variable. In that circumstance, the effect of the omitted variable on the outcome may incorrectly be attributed to the variable of interest. Here, the variable of interest is race, so the omission of variables that are correlated with race and affect admissions outcomes—such as the non-academic factors discussed throughout this report—can lead the model to misattribute to race differences in admissions outcomes that are in fact attributable to the omitted variables.
Id.
For similar discussion of the need to account for omitted variable bias in other contexts outside the Harvard admissions case, see also Sherod Thaxton, How Not to Lie About Affirmative Action, 67 UCLA L. Rev. 834, 886–93 (2020); Daniel L. Rubinfeld, Reference Guide on Multiple Regression, in Fed. Jud. Ctr., Reference Manual on Scientific Evidence 303, 31415 (3d ed. 2011).
[37]. A short definition of “personal rating” from the district court opinion is as follows:
The personal rating reflects the admissions officer's assessment of what kind of contribution the applicant would make to the Harvard community based on their personal qualities. Although the reading procedures have not historically provided detailed guidance on what qualities should be considered in assigning a personal rating, relevant qualities might include integrity, helpfulness, courage, kindness, fortitude, empathy, self-confidence, leadership ability, maturity, or grit.
President & Fellows of Harvard Coll., 397 F. Supp. 3d at 141 (citations omitted).
[38]. Id. at 169, 173; see also Thaxton, supra note 36, at 892 (noting that a common symptom of omitted variables is low predictive ability).
[39]. These NCAA freshmen data are for prior cohorts (2006 to 2014) because they are disclosed for purposes of tracking graduation rates.
[40]. Arcidiacono concedes this point to some extent with respect to the overall Harvard admissions pool. See Peter Arcidiacono, Josh Kinsler & Tyler Ransom, Asian American Discrimination in Harvard Admissions, 144 Eur. Econ. Rev. 1, 3 (2022) (“Around 8% do not report their race, with some evidence that this group is disproportionately white and Asian American.”). On that point, Arcidiacono et al. cite to Arcidiacono’s expert report. See Expert Report of Peter S. Arcidiacono at 77, President & Fellows of Harvard Coll., 397 F. Supp. 3d 126 (No. 14-cv-14176) (“Particularly starting from the class of 2010 admissions cycle, rises (falls) in the share missing are accompanied by falls (rises) in the share of both Asian-American and white applicants.”). And since Asian Americans are a much smaller share of the college athlete population in the Ivy League compared to the student body at those schools, we (the authors) are more confident that for college athletes specifically the expectation that this “did not report race” population is mostly white.
[41]. These data are compiled from NCAA federal graduation rate reports. NCAA Graduation Success Rate, Nat'l Collegiate Athletic Ass'n, http://web3.ncaa.org/aprsearch/gsrsearch [https://perma.cc/9ZD2-8BF2] (select the university and “overall” sports; then go to FGR reports for 2014, 2010 and 2006, which each combine data for four freshmen classes).
[42]. Jayakumar & Page, supra note 22.
[43]. The term “country club sports”—such as lacrosse, fencing, golf, field hockey—is widely used in the literature, particularly in reference to Ivy League athletics. Sometimes, scholars use “Olympic sports” as well. See, e.g., Kirsten Hextrum, The Hidden Curriculum of College Athletic Recruitment, 88 Harv. Educ. Rev. 355, 356 (2018); Kerrissa Heffernan, White Wash: Persistent Inequity and Privilege in Ivy League Athletic Departments, 51 Change 12, 13 (2019); William B. Morrison, Note, Country Club Sports: The Disparate Impact of Athlete Admissions at Elite Universities, 46 BYU L. Rev. 883 (2021).
[44]. Jayakumar & Page, supra note 22, at 1113, 113031.
[45]. Jayakumar & Page, supra note 22, at 1116, 112728.
[46]. Jayakumar & Page, supra note 22, at 1115.
[47]. The Native Legacy at Dartmouth College, Dartmouth: Native Am. Program,, https://students.dartmouth.edu/nap/about/history [https://perma.cc/TSK8-AL8T].
[48]. See Figure 2, supra. We say “roughly” because in one four-year period the number is four, in another it is zero, and in a third four-year period it is listed as “***” which is a way of handling small cell sizes less than five. See NCAA Graduation Success Rate, supra note 41.
[49]. Allan Downey, The Creator's Game: Lacrosse, Identity, And Indigenous Nationhood 19 (2018); Lena Camara, A History of Iroquois Nationals Lacrosse, Iriquoius Natl's, https://iroquoisnationals.com/the-iroquois/a-history-of-iroquois-nationals-lacrosse [https://perma.cc/J4PG-9FEH].
[50]. See Canada Beats Iroquois to Win Gold, USA Takes the Bronze, World Lacrosse (Sept. 29, 2019), https://worldlacrosse.sport/article/canada-beats-iroquois-to-win-gold-usa-takes-the-bronze/ [https://perma.cc/35TV-WXZ6].
[51]. Jayakumar & Page, supra note 22, at 1128; see also Jayakumar & Page, supra note 22, at 1130 (“Our position is not necessarily that schools should not admit exceptional performers. Instead, we wish to increase awareness of the extent of the bias in what is characterized as exceptional and how this caters to a wealthy white habitus.”).
[52]. Report of David Card, supra note 35, at 35 exhibit 7.
[53]. Brief for Petitioner, supra note 6, at 72–73, Students for Fair Admissions, Inc. v. President & Fellows of Harvard Coll., 142 S. Ct. 895 (2022) (No. 20-1199).
[54]. Arcidiacono, Kinsler & Ransom, supra note 23, at 136; William L. Wang, Filings Show Athletes with High Academic Scores Have 83 Percent Acceptance Rate, Harv. Crimson (June 30, 2018), https://www.thecrimson.com/article/2018/6/30/athlete-admissions/ [https://perma.cc/US6A-DMVK] (“Arcidiacono noted that recruited athletes with an academic rating of 4 had an acceptance rate of 70.46 percent, nearly a thousand times greater than the 0.076 percent admit rate for non-athletes with the same academic rating.”).
[55]. Brief for Petitioner, supra note 6, at passim.
[56]. William C. Kidder, The Salience of Racial Isolation: African Americans' and Latinos' Perceptions of Climate and Enrollment Choices With and Without Proposition 209 209 5 (2012) (“As noted by a number of social scientists, affirmative action bans create ‘natural experiments’ that open possibilities for testing important questions of public policy related to racial/ethnic inequality in America.”); Sigal Alon & Marta Tienda, Diversity, Opportunity, and the Shifting Meritocracy in Higher Education, 72 Am. Socio. Rev. 487, 487 (2007) (analyzing the “natural experiment in Texas after the implementation of the ‘top 10 percent’ law”).
[57]. Mark C. Long & Nicole A. Bateman, Long-Run Changes in Underrepresentation After Affirmative Action Bans in Public Universities, 42 Educ. Evaluation & Pol'y Analysis 188 (2020); Peter Hinrichs, Affirmative Action Bans and College Graduation Rates, 42 Econ. Educ. Rev. 43, 45 (2014).
[58]. Brief of 1,246 American Social Science Researchers and Scholars as Amici Curiae in Support of Respondents at 10–14, Students for Fair Admissions, Inc. v. Univ. of N.C., No. 21-707 (U.S. argued Oct. 2022) [hereinafter Brief of 1,246 Researchers and Scholars].
[59]. María C. Ledesma, California Sunset: O’Connor’s Post-Affirmative Action Ideal Comes of Age in California, 42 Rev. Higher Educ. 227, 243 (2019); see also Michal Kurlaender, Elizabeth Friedmann & Tongshan Chang, Access and Diversity at the University of California in the Post-Affirmative Action Era, in Affirmative Action and Racial Equity 80, 92 (Uma M. Jayakumar, Liliana M. Garces & Frank Fernandez eds., 2015).
[60]. Stella M. Flores & Catherine L. Horn, Texas Top Ten Percent Plan: How It Works, What Are Its Limits, and Recommendations to Consider, in Alternative Paths to Diversity: Exploring and Implementing Effective College Admissions Policies 14, 25 (Gary Orfield ed., 2017).
[61]. Liliana M. Garces & Uma M. Jayakumar, Dynamic Diversity: Toward a Contextual Understanding of Critical Mass, 43 Educ. Researcher 115, 117 (2014).
[62]. In SFFA v. UNC, SFFA argued that accounting for socioeconomic diversity was sufficient to achieve the benefits of diversity, even though the district court found class-based race-neutral alternatives to be “unworkable” at UNC. For a review of these claims and related social science research, see Brief of 1,246 American Social Science Researchers and Scholars, supra note 58, at 25–30.
[63]. William C. Kidder, How Workable Are Class-Based and Race-Neutral Alternatives at Leading American Universities?, 64 Ucla L. Rev. Disc.100, 131 (2016).
“Michigan represents a natural experiment disconfirming the suggestion that leading public universities can or will significantly enhance class-based financial aid and admissions in tandem as a race-neutral alternative. In this vein, the University of California represents a natural experiment of a different sort, pointing to the upper limits of what elite public universities and state lawmakers are willing to sustain financially . . . .” Id.
[64]. For example, at UC Riverside (UCR) (which has a modest NCAA Division I program) via past student referenda each student currently pays $105 annually ($35/quarter) to support athletics. Quarterly Undergraduate Tuition and Fees, U.C. RIVERSIDE (2023), https://registrar.ucr.edu/Quarterly-Undergraduate-Tuition-and-Fees [https://perma.cc/ 5BER-XS9A]. Similarly, at the national level Denhart and Ridpath report based on data derived from public records requests: “At many schools, intercollegiate athletics is a major recipient of general fee revenues. Indeed, of the 207 Division I public schools for which we have data, 169 (i.e. 81 percent) of them allocate student fee revenues directly to athletics.” Matthew Denhat & David Ridpath, Ctr. Coll. Affordability & Productivity, Funding the Arms Race: A Case Study of Student Athletic Fees1, 3 (2011), https://files.eric.ed.gov/ fulltext/ED536146.pdf [https://perma.cc/2CGS-S7EK].
[65]. Univ. Cal., Undergraduate Financial Aid Report Systemwide: Academic Year 2020–21, at 1–2 (2021), https://www.ucop.edu/enrollment-services/_files/acadyear2021 systemwide.pdf [https://perma.cc/MK4Q-TBGG]. Most low-income students receive a combination of UC, state, and federal grant aid, though not necessarily for the average amounts listed above.
[66]. The data referred to in this paragraph is summarized in Tables 1 and 2, infra.
[67]. This empirical expectation follows directly from the fact that the Admission by Exception (AxE) category blends together positive consideration for low-income background with the “special talent” category that is mostly composed of (disproportionately affluent) college athletes. See Bd. Admissions & Rels. With Schs., supra note 26, at 3 (“[A]s specified in Regents policy, within the overall limit of 6 percent, up-to-4 percent of these enrollments be reserved for students from disadvantaged circumstances, including but not limited to low-income students and first-generation college students . . . . The remaining up-to-2 percent may include ‘other students’ to include students with special talent.”). Thus, the AxE category combines subcategories that likely reflect a bimodal distribution with respect to family wealth and income background.
[68]. Lisa J. Dettling, Joanne W. Hsu, Lindsay Jacobs, Kevin B. Moore, Jeffrey P. Thompson & Elizabeth Llanes, Recent Trends in Wealth-Holding by Race and Ethnicity: Evidence from the Survey of Consumer Finances, Feds Notes tbl.1 (Sept. 27, 2017), https://www.federalreserve.gov/econres/notes/feds-notes/recent-trends-in-wealth-holding-by-race-and-ethnicity-evidence-from-the-survey-of-consumer-finances-20170927.html [https://perma.cc/E7SG-E4CT].
[69]. Id.
[70]. Neil Bhutta, Andrew C. Chang, Lisa J. Dettling, Joanne W. Hsu & Julia Hewitt, Disparities in Wealth by Race and Ethnicity in the 2019 Survey of Consumer Finances, Feds Notes (Sept. 28, 2020), https://www.federalreserve.gov/econres/notes/feds-notes/disparities-in-wealth-by-race-and-ethnicity-in-the-2019-survey-of-consumer-finances-20200928.html [https://perma.cc/7UVT-4JVX] (reporting data from the 2019 Survey of Consumer Finances).
[71]. Id.
[72]. Id.
[73]. Mark Nord, Margaret Andrews & Steven Carlson, U.S. Dep't Agric., Econ. Rsch. Rep. No. 49, Household Food Security In The United States, 2006, at 12 tbl.3 (2007), https://www.ers.usda.gov/webdocs/publications/45889/12224_err49_1_.pdf [https://perma.cc/ 5BD8-SECN].
[74]. Andre Perry, Jonathan Rothwell & David Harshbarger, Brookings Inst., The Devaluation of Assets In Black Neighborhoods: The Case of Residential Property 3 (2018), https://www.brookings.edu/wp-content/uploads/2018/11/2018.11_Brookings-Metro_Devaluation-Assets-Black-Neighborhoods_final.pdf [https://perma.cc/27UA-3SCF].
[75]. William Darity Jr., Darrick Hamilton, Mark Paul, Alan Aja, Anne Price, Antonio Moore 7 Caterina Chiporis, Samuel Dubois Cook Ctr. Soc. Equity, What We Get Wrong About Closing The Racial Wealth Gap (2018), https://socialequity.duke.edu/wp-content/uploads/2019/10/what-we-get-wrong.pdf [https://perma.cc/CJ2A-E239] (reporting data from the U.S. Census Bureau’s Survey of Income and Program Participation survey).
[76]. Ethics, Compliance & Audit Servs., Univ. Cal., Proj. No. P20A005, Systemwide Audit of Undergraduate Admission: Phase 2, at 27, (2020), https://www.universityof california.edu/sites/default/files/second-audit-report.pdf [https://perma.cc/2JKM-9TDZ].
[77]. See Bd. Of Admissions & Rels. WIth Schs., supra note 26, at 8.
[78]. Ethics, Compliance & Audit Servs., supra note 76, at 25–27.
[79]. Dettling et al., supra note 68. Differences in family income shape enrollment patterns by type of college for white versus Black and Latinx students (e.g., selective versus non-selective, four-year versus two-year, etc.), but are also manifest in differences in family income distributions by race/ethnicity (with white students having higher rates of affluence) among students who enroll in selective universities nationwide. See also, Rachel Baker, Daniel Klasik & Sean F. Reardon, Race and Stratification in College Enrollment Over Time, 4 Aera Open 1, 11 figs. 5-6 (2018); Anthony P. Carenavale, Martin Van Der Werf, Michael Q. Quinn, Jeff Strohl & Dmitri Repnikov, Our Separate & Unequal Public Colleges: How Public Colleges Reinforce White Racial Privilege and Marginalize Black and latino Students 7 (2018), https://cew.georgetown.edu/wp-content/uploads/SAUStates_FR.pdf [https://perma.cc/2HC6-Z8TT] (“Family income is highly correlated with race and ethnicity. This competitive dynamic results in systematically excluding minority students.”)
[80]. Data were generously provided by the admissions office at UCLA with the intent of supporting an understanding of race-neutral admissions. These data included enrolled students admitted by exception Fall 2018, Fall 2019, and Fall 2020. We had demographic data by race/ethnicity but not socioeconomic status. Notably, UCLA and UCR were the only admissions offices that were willing to share data with us, while others were asked but were either nonresponsive or declined.
[81].NCAA Rsch. Trends In the Participation of International Student-Athletes In NCAA Divisions I and II(2020), https://ncaaorg.s3.amazonaws.com/research/demographics/ 2020RES_ISATrendsDivSprt.pdf [https://perma.cc/WA22-K977].
[82]. Id.
[83]. Id.
[84]. Kirsten Hextrum, Amateurism Revisited: How U.S. College Athletic Recruitment Favors Middle-Class Athletes, 25 Sport. Educ. & Soc'y111, 114 (2020).
[85]. NCAA Demographics Database, NCAA (2021), https://www.ncaa.org/sports/2018/12/ 13/ncaa-demographics-database.aspx [https://perma.cc/6R6K-WN3K].
[86]. NCAA Rsch., supra note 81. The data in this NCAA report show that the “top ten” lists of countries for international college athletes are Canada, United Kingdom, Australia, Germany, Spain, Sweden, New Zealand, Netherlands, Norway, and France. NCAA RSCH., supra note 81. Relatedly, this NCAA report confirms that the top NCAA Division I women’s sports for international students are mostly sports with high percentages of white students (tennis, soccer, track, golf, swimming, basketball, and field hockey) and likewise for Division I men’s teams (soccer, tennis, basketball, track, golf, ice hockey, and swimming). NCAA Rsch., supra note 81.
[87]. See Table 4, supra. Or 45 percent, if we were to assume as a plausible lower-bound that about seven in ten international AxE athletes were white. For clarity, note that federal data reporting does not require tracking race/ethnicity of international (“non-resident [noncitizen]”) students, in contrast to how race/ethnicity are important domestic student categories. As stated in the UC audit on AxE, “The United States Department of Education requires international students to be reported as nonresident [noncitizens], and therefore their racial or ethnic identity is indicated as ‘international’ in University data.” Ethics, Compliance & Audit Servs., supra note 76, at 25 n.5.
[88]. NCAA Rsch., supra note 81 (showing that in 2022 Asian Americans were only 2.1% of NCAA athletes and Asian Americans were only 0.4% of those serving in the leadership position of director of athletics). For associated reasons, white students who are college athletes derive some mental health benefits from being in intercollegiate athletics, whereas Asian American and Pacific Islander athletes face a landscape of challenging stereotypes and report worse mental health outcomes compared to both whites and Asian American non-athletes. See Alisia G.T.T. Tran, Looking Forward to Student-Athlete Mental Health: Racial/ethnic trends from 2010 to 2015, 69 J. Am. Coll. Health 942, 948–49 (2021), concluding from a large study of nearly 40,000 U.S. college athletes using the American College of Health Association’s National College Health Assessment that:
When comparing student-athletes and nonstudent-athletes across time, student-athlete status appeared to be most consistently beneficial for White student-athletes relative to their nonstudent-athlete counterparts. In contrast, Asian/ Pacific Islander student-athletes did not appear to be benefited by student-athlete status—if anything, student-athlete status may have been a liability in terms of risk for suicide attempts for Asian/Pacific Islanders. Id.
[89]. Bd. Of Admissions & Rels. With Schs., supra note 26, at 8.
[90]. See Ethics, Compliance & Audit Servs., supra note 76, at 25 n.7.
[91]. Hextrum, supra note 84, at 114.
[92]. See Melany De La Cruz-Viesca, Zhenxiang Chen, Paul M. Ong, Darrick Hamilton & William A. Darity Jr., The Color of Wealth In Los Angeles22 tbl.1 (2016), https://www.aasc.ucla.edu/besol/color_of_wealth_report.pdf [https://perma.cc/RV7Z-4F2Q].
[93]. Id. at 38 tbl.8, 40 tbl.10.
[94]. Id. at 38 tbl.8, 40 tbl.10. For Mexican Americans in Los Angeles, the median net worth and median liquid worth is $3,500 and $0, respectively. Id.
[95]. Id. at 25 (“Liquid assets—financial assets, unlike a home, which can be quickly converted into cash in times of reduced income or increased costs . . . .”); Scott R. Baker, Robert A. Farrokhnia, Steffen Meyer, Michaela Pagel & Constantine Yannelis, Income, Liquidity, and the Consumption Response to the 2020 Economic Stimulus Payments 1 (Nat’l Bureau Econ. Rsch., Working Paper No. 27097, 2020) (“Households with lower incomes, greater income drops, and lower levels of liquidity display stronger responses highlighting the importance of targeting. Liquidity plays the most important role, with no significant spending response for households with large checking account balances.”).
[96]. See Nat’l Collegiate Athletic Ass’n v. Alston, 141 S. Ct. 2141, 2168 (2021) (Kavanaugh, J., concurring) (“[T]he student athletes who generate the revenues, many of whom are African American and from lower-income backgrounds, end up with little or nothing [from their labor].”); Billy Hawkins, The New Plantation: Black Athletes, College Sports, and Predominantly White NCAA Institutions 51 (2010) (“The economically challenging conditions a significant percentage of Black athletes come from in some ways force them to use their athletic talents in hopes of improving their immediate conditions and the conditions of their families.”).
[97]. See Kirsten Hextrum, Reproducing Sports Stars: How Students Become Elite Athletes, 121 Tchrs. Coll. Rec. 1, 11-12 (2019).
[98]. Data were generously provided by the admissions office at UCR with the intent of supporting an understanding of race-neutral admissions. These data included enrolled students admitted by exception Fall 2018, Fall 2019, and Fall 2020. We had demographic data by race/ethnicity but not socioeconomic status. Notably, UCR and UCLA were the only admissions offices that were willing to share data with us, while others were asked but were either nonresponsive or declined.
[99]. Equity in Athletics Data Analysis: Get Data for One School, U.S. Dep't Educ., https://ope.ed.gov/athletics/#/institution/search [https://perma.cc/B68T-T8LJ] (search school under name; then continue to “view data” and select “revenues and expenses”).
[100]. See e.g., The Scandal of Standardized Tests: Why We Need to Drop the SAT and ACT (Joseph A. Soares ed., 2020); Dania V. Francis, Angela C. M. de Oliveira & Carey Dimmitt, Do School Counselors Exhibit Bias in Recommending Students for Advanced Coursework?, 19 B.E. J. Econ. Analysis & Pol'y 1 (2019); Di Xu, Sabrina Solanki & John Fink, College Acceleration for All? Mapping Racial Gaps in Advanced Placement and Dual Enrollment Participation, 58 Am. Educ. Rsch. J. 954 (2021).
[101]. See Andrea Flynn, Susan R. Holmberg, Dorian T. Warren, & Felicia J. Wong, The Hidden Rules of Race: Barriers to an Inclusive Economy 173 (2017) (“[G]ender- and race-neutral policies and programs have disproportionately benefited white Americans at the peril of everyone else.”).
[102]. Regents of the Univ. of Cal. v. Bakke, 438 U.S. 265 (1978).
[103]. Id. at 306 n.43.
[104]. Devon W. Carbado, Footnote 43: Recovering Justice Powell’s Anti-Preference Framing of Affirmative Action, 53 U.C. Davis L. Rev. 1117, 1121 (2019).